Read more
The post What Is Customer Effort Score (CES) & Why Does It Matter? appeared first on Interaction Metrics.
]]>Customer Effort Score (CES) measures how hard it is for your customers to get help from your customer service teams. And if you’ve ever had a hard time canceling a subscription or fixing a billing issue, you know exactly why it matters.
Has this ever happened to you? You clicked through five help articles, waited on hold for 20 minutes, and answered the same question twice.
At that point, you’re well beyond annoyed and ready to give up.
That’s where Customer Effort Score (CES) comes in. You can use it to gauge which processes are frustrating for customers and how to remove that friction.
Introduced by Matt Dixon and Corporate Executive Board (CEB) in 2010, CES is now a core metric in many customer experience programs.
CES has a clear purpose, but it’s often misunderstood.
Some companies automate their CES surveys. They send them out after every interaction, regardless of context, and that in itself is a source of customer frustration.
Others drop CES into customer feedback programs without giving much thought to question design or survey timing.
The problem with this approach is that you’re left with a flood of surface-level data that’s easy to ignore and hard to act on. Companies that measure CES like this are missing the point of CES entirely, which is to find friction and fix it—not to create more friction.
That’s why we take a different approach.
Interaction Metrics is a leading survey company. We’ve seen how strategically measuring your customer effort score can reveal moments of struggle that other metrics miss.
We focus on asking the right question at the right time, using survey methods that eliminate bias and deliver meaningful insight.
Because when you understand where customers are getting stuck, you can improve service, reduce churn, and build loyalty without overwhelming your team.
Here’s everything you need to know about CES: how it works, why it matters, and how you can use it to create loyal customers who stick around for the long haul.
When you’re ready to start measuring your CES score, reach out to Interaction Metrics.
What Is Customer Effort Score (CES)?
Customer Effort Score (CES) measures how easy it is for customers to get help or complete a task when interacting with your company.
Unlike NPS (which measures loyalty) or CSAT (which gauges satisfaction), CES focuses on one thing: effort.
One way to measure effort is to ask after an interaction (like a support call or a purchase), like:
“How easy was it to handle your issue today?”
“How easy was our shopping cart?”
“How easy was your onboarding experience?”
Then you might use a 5-point, 7-point, or an emoticon scale, with the left anchor being very difficult and the right anchor being very easy. That’s it. One question. One number. And when asked at the right time, CES can uncover friction that other customer service metrics miss.
But there is another way to measure customer effort, which tends to be more accurate.
You take all the questions in your survey that imply customer effort, and calculate the average of all those variables. These could be rating questions about agent clarity, website navigation, or time-to-respond.
So instead of asking your customer if something was easy, you determine the overall ease of doing business with your company. Whether to use one question or look at variables globally depends on your objectives and what you need to know.

Why Customer Effort Score Matters for Customer Satisfaction
Your customers are busy. They have options. If dealing with your business feels complicated or frustrating, they’ll move on to competitors who offer simpler interactions.
That’s why Customer Effort Score (CES) matters so much for overall customer satisfaction.
Unlike other customer experience metrics, CES doesn’t measure how happy or loyal someone feels. It measures how hard they had to work to get what they needed.
As Bill Price, co-author of The Best Service Is No Service, famously argued, the best customer service is the one customers never have to use.
Here’s why.
- High Effort Service Interactions = Lost Customers: The harder it is to get help, the faster customers leave. Gartner found that 96% of customers who face high-effort service experiences become disloyal customers.
- Low Effort Builds Loyalty: When things feel easy, customers stick around. Providing customers with a low-effort experience leads to higher retention, more spending, and more referrals. It encourages customers to stick around and speak positively about your brand.
- CES Predicts Future Purchase Behavior: Low effort means customers are likely to buy again. High effort can signal that churn is just around the corner. Depending on the product or service, customers who feel too much friction are likely to cease buying from you altogether.
- Less Effort = Better Customer Engagement: The less effort customers spend solving problems, the more likely they are to explore your products and engage with your brand.
- You Can Identify and Remove Pain Points: CES shows exactly where customers feel stuck, whether that’s a clunky checkout, a confusing help center, long wait times, or handoffs between multiple departments.
- Reduce Customer Service Costs: When customers can help themselves, support requests go down. Fewer calls and fewer tickets translate to lower customer service costs.
CES isn’t a metric to take lightly. It reveals the truth about customer friction, and addressing it can take your entire customer experience to the next level.
If you want satisfied customers who stay, spend more, and recommend your business, reducing customer effort must be a core part of your strategy.
When to Use a Customer Effort Score Survey
Timing matters with CES.
If you send surveys too randomly, you’ll miss the exact moments when effort is highest. When you send them at the right time, CES surveys reveal where your customers struggle and how to fix it.
Here are the best times to send a CES survey, with real-world examples:
1. After Customer Support Interactions
Send a CES survey after a client chats with your customer support team or calls in for help.
Example: A customer contacts customer support to dispute a charge. Once the issue is resolved, send a CES survey and be sure to include at least one open-ended question so you can understand what’s driving your scores.
2. Following a Purchase or Transaction
Send a survey after checkout to learn how smooth the buying experience was.
Example: A customer buys a subscription online. After the confirmation email, follow up with a CES question asking how easy it was to complete the purchase.
3. During Onboarding Processes
Use CES to check if your onboarding process makes sense to new users.
Example: A new customer signs up for your platform and completes the setup wizard. After setup, ask how easy it was to get started.
4. After Using Self-Service Options
Test whether your help center, chatbot, or FAQ is actually helpful.
Example: A customer uses your help center to figure out how to reset their password. Show a CES question after they’ve finished the article to gauge the experience.
5. When Renewing or Upgrading Services
These moments often involve complex decisions or system navigation.
Example: A customer upgrades their account from a free to a paid plan. After they finish, ask how easy the upgrade process was.
6. After Addressing Specific Pain Points
Once you’ve simplified a frustrating process, check if the update worked.
Example: You redesigned your billing page to make it easier to update credit card info. Send a CES survey right after a customer uses that page to see if the change actually reduced effort.
Measuring customer effort at targeted points throughout the entire customer journey helps customers avoid overwhelm from constant surveys, and you gain clear, actionable data to drive improvements.
Next, we’ll look closely at exactly how to measure and interpret your CES results to improve overall customer satisfaction.
How to Measure Customer Effort Score: Questions, Scales & Formulas
To get the most value from your Customer Effort Score (CES), you need clarity on how to structure your surveys and interpret the results.
Here’s exactly how to measure CES effectively:
1. Choose the Right Question Format
CES surveys typically ask one straightforward question, such as:
- “How easy was it to resolve your issue today?” (standard CES question)
- “The company made it easy to handle my request.” (agree/disagree format)
Choose wording that aligns clearly with the interaction you’re assessing.
2. Select an Effective Rating Scale
CES commonly uses one of three formats:
- Numbered Scales (most common): Usually 1–7 or 1–5 (1 = very difficult, 5 or 7 = very easy).
- Likert Scales: Customers rate their agreement with a statement from “strongly disagree” to “strongly agree.”
- Emoticon Ratings: Frowning faces for difficult interactions, neutral faces for moderate effort, and smiley faces for easy interactions.
Pick a scale that feels intuitive for your customers. Simpler scales tend to get higher response rates.

3. Calculate Your CES Score
The Customer Effort Score calculation is a simple average. Add together the total scores from all responses, then divide the total by the number of responses.
And when calculating your score, don’t forget to segment your customers so you can perform cross-tab analysis.
Breaking your customer base into smaller groups allows you to determine in what situations you’re getting particular scores, and for whom.
This way, you know you’re getting a true picture of customer effort instead of focusing on one specific group (for example, women over 50 with a bachelor’s degree) disproportionately.
Use the formula to get an average CES rating for each segment, then take the average score of each segment and use it to get an idea of overall customer effort.
Higher scores (closer to 5) indicate better customer experiences. Lower scores suggest frustration and friction.
4. Analyze Comments, Not Just Numbers
CES numbers give direction, but open-ended responses provide deeper insights.
Look carefully at customers’ written comments for common themes.
Words like “confusing,” “fast,” “frustrating,” or “easy” show exactly where your service is succeeding or failing.
What’s a Good Customer Effort Score?
A “good” CES score depends on the scale you’re using:
- On a 5-point scale, most companies aim for an average score of 4 or higher.
- On a 7-point scale, aim for 5 or higher.
If your average is creeping below those numbers, it likely means customers are encountering friction—slow response times, confusing processes, or broken self-service tools.
Here are a few points to keep in mind after calculating CES.
1. Higher Scores Are Better
Generally, you want scores on the higher end (closer to 5 or 7). Higher scores signal that your customers find interactions straightforward and frustration-free.
2. Compare to Industry Benchmarks
While there’s no universal benchmark, many companies target a CES average of around 4 on a 5-point scale (or about 5 on a 7-point scale).
If your scores are consistently lower, your customers might face unnecessary challenges.
3. Track Changes Over Time
CES is most valuable when you track it consistently and compare it month-over-month or quarter-over-quarter.
Even small improvements (like a CES increase from 2.7 to 3.0) indicate meaningful enhancements to your customer experience.
4. Look Beyond the Numbers
Don’t just rely on your average score. Analyze CES data by specific interactions, support channels, and agents. Averages alone might hide issues like specific customer support agents who are struggling or a certain product causing confusion.
5. Take Action on the Insights
The goal of CES isn’t just measurement—it’s improvement. Use CES results to clearly identify areas of friction. Then, simplify processes, improve agent training, and make proactive changes to reduce customer frustration.
How to Improve Your Customer Effort Score
CES reveals where your customers face unnecessary challenges. Once you pinpoint these pain points, here’s how to address them directly:
1. Streamline Customer Interactions
Look at the entire customer journey and remove unnecessary steps. Are customers being passed between multiple agents or repeating their problems multiple times? Simplify these interactions.
2. Enhance Self-Service Options
Invest in intuitive, easy-to-use self-service tools like knowledge bases, FAQs, chatbots, or automated phone systems. Good self-service reduces effort and prevents unnecessary interactions with your support team.
3. Offer Solution-Oriented Training
Equip your customer service representatives with the tools, training, and scripts needed to solve problems quickly. Reducing back-and-forth interactions and eliminating confusion makes a big difference in CES scores.
4. Provide Omnichannel Support
Customers often switch channels when they encounter problems. Whether starting online, via chat, or phone, be sure interactions are consistent across every channel. Customers should never feel they’re starting over each time they reach out.
5. Reduce Response Times
Shortening hold times and quickly responding to emails and chats improve customer perception. High service efficiency makes interactions feel easy and reduces customer frustration.
6. Proactively Address Common Issues
Use CES feedback to identify recurring problems (billing confusion, delayed shipments, etc.). Then proactively communicate solutions before customers even notice or complain. This approach can significantly lower your CES.
7. Monitor & Measure Progress
After taking these steps, keep tracking CES. Continuously measure whether your actions translate to lower customer effort. Regular tracking uncovers improvements and highlights new areas to optimize.
Improving your CES means happier customers, fewer service costs, and higher loyalty. Next, let’s clearly distinguish how CES compares to other popular metrics—NPS and CSAT—and why you need all three for a complete CX picture.
Customer Effort Score vs. NPS & CSAT: What’s the Difference?
Customer Effort Score is powerful. But if you look at just one metric, it’s like using a pair of prescription glasses that have only one lens.
To get a full picture of your customer experience, pair CES with other core metrics like Net Promoter Score (NPS) and Customer Satisfaction Score (CSAT).
Each one tells you something different:
- CES shows how much effort the customer had to exert.
- NPS reveals how likely they are to recommend your brand.
- CSAT captures how satisfied they were with a specific interaction.
By combining them, you uncover customer insights that would otherwise go unnoticed.
5 Customer Effort Score Mistakes to Avoid
CES can mislead you if you’re not careful. Here are common mistakes to avoid, so your CES results stay accurate and actionable.
1. Poor Survey Timing
If your CES survey isn’t sent immediately after the right customer service touchpoint, customers may forget key details. Late surveys produce inaccurate data that won’t clearly reflect true customer effort.
Always send CES surveys promptly—right after each relevant interaction, while customers’ experiences are fresh.
2. Vague or Misleading Questions
Asking unclear or overly broad questions confuses customers. A vague CES question leads to vague responses, leaving you without actionable insights.
Use precise, straightforward questions like: “How easy was it to resolve your billing issue today?”
3. Over-Reliance on Numbers Alone
CES numbers highlight general friction points but rarely explain why friction exists. If you rely solely on numeric scores, you’ll miss essential details behind customer struggles.
Always include an open-ended question for comments. Customer comments provide context and deeper insight into why your CES scores are high or low.
4. Misinterpreting Results Without Context
A sudden spike in CES may seem alarming. But it could reflect temporary issues (e.g., a website outage) rather than systemic problems.
Always analyze CES data within context. Review external factors—like service outages, product changes, or training issues—that may influence scores.
5. Failing to Take Action
Collecting CES without acting on insights frustrates customers. Customers who repeatedly share feedback without seeing improvements become disillusioned and eventually churn.
Identify issues your CES reveals. Take visible, concrete actions. Communicate those improvements back to customers to build trust and loyalty.
Avoiding these pitfalls ensures your CES surveys produce accurate data and real business improvements.

Do More Than Simply Collect Data
Customer Effort Score is a powerful tool for real improvement. But it only works if you act on what your customers tell you.
Too many companies collect CES data only to let it gather dust. They miss the opportunity to reduce friction, simplify interactions, and improve customer service altogether.
Don’t make that mistake.
When customers share feedback, they expect improvement. Listen carefully to what they say. Identify exactly where they struggle and act decisively to simplify those interactions.
At Interaction Metrics, we believe measuring customer effort should always lead directly to real change. Every survey you send should deliver clear insights, actionable steps, and measurable results.
Don’t settle for generic, one-size-fits-all surveys that deliver vague results. Go deeper. Identify pain points. Remove friction. Then, communicate improvements back to your customers.
Discover A Better Way to Measure CES
At Interaction Metrics, we believe CES demands a more disciplined, thoughtful approach.
We’re a full-service survey firm with a scientific, rigorous approach to measuring customer effort.
Our TrueData model transforms CES from raw numbers into actionable insights that drive your business forward.
Here’s how the TrueData model works:
1. True-Facts: Scientifically Valid Surveys
Every CES survey is custom-built for your company. We use an exclusive 20-point bias checklist to eliminate leading questions or skewed data. That means you get genuinely accurate survey responses that reflect true customer effort.
2. True-Tech: World-Class Survey Software
We license top-tier software tools like Qualtrics, Alchemer, and SPSS. With us, you get enterprise-level data analysis without the hassle or expense of managing software yourself.
Our experts manage all survey creation, deployment, and analytics to free up your resources.
3. True-Insight: Actionable Analysis
CES numbers alone can’t drive improvements. That’s why we go deeper. We use techniques like text mining, correlation analysis, and cross-tabs to understand the full story behind your CES scores. So you receive clear, actionable recommendations to improve your customer interactions right away.
At Interaction Metrics, we move beyond CES measurement into genuine customer experience improvement.
We pinpoint exactly why your customers experience friction. Then we provide practical guidance to simplify customer service interactions, reduce frustration, and build lasting loyalty.
If you’re serious about lowering customer effort and improving your customer relationships, Interaction Metrics has the clear, rigorous approach you need. Let’s discuss your survey needs today.
FAQs About Customer Effort Score
What is the difference between CES, NPS, and CSAT?
CES (Customer Effort Score) measures how easy it is for a customer to complete an interaction. NPS (Net Promoter Score) measures loyalty and willingness to recommend. CSAT (Customer Satisfaction Score) measures how satisfied a customer feels after a specific interaction. Using all three gives you a complete view of the customer experience.
What is a good Customer Effort Score benchmark?
A good Customer Effort Score is typically 4 or higher on a 5-point scale. Higher scores mean customers experienced less friction. Scores below 4 may indicate areas that need improvement. Trends over time are more important than one specific number.
How often should I send a CES survey?
You should send a CES survey after key customer interactions. These include after a support call, product purchase, or using a self-service feature. Timely, event-based surveys deliver more accurate and actionable feedback.
What is the best CES question to ask?
The best CES question is: “How easy was it to resolve your issue today?” It’s simple, clear, and directly tied to the customer’s experience. It works well across support, billing, onboarding, and more.
Can CES predict customer behavior?
Yes, Customer Effort Score can predict customer behavior. High-effort experiences often lead to churn, while low-effort interactions increase long-term customer loyalty and repeat purchases. CES is one of the strongest predictors of future customer retention.
============================================
Care to discuss your next survey? Get in touch!
============================================
The post What Is Customer Effort Score (CES) & Why Does It Matter? appeared first on Interaction Metrics.
]]>Read more
The post How to Increase Customer Retention: 15 Proven Strategies That Work appeared first on Interaction Metrics.
]]>What Is Customer Retention and Why Does It Matter?
Customer retention may sound like business jargon, but really, it’s just the art of keeping your customers happy enough that they stick around.
Think about your favorite coffee shop. Maybe they offer you a punch card where you earn a free coffee after ten purchases. That’s customer retention at work—using incentives and positive experiences to keep you coming back.
Customer retention matters because keeping your customers is easier than chasing new ones. When you look at how quickly advertising costs, introductory offers, sales pitches and tools add up, acquiring a new customer typically costs way more than retaining an existing one.
But why?
Because your existing customers have already said “yes” to your brand at least once.
If you keep them smiling, they’ll keep saying yes, without the need for costly courtship.
And the payoff is massive. According to Harvard Business Review, bumping up your retention by just 5% can boost profits by 25% to 95%. That’s a huge return on investment for simply treating customers a little better.
Plus, loyal customers do more than just give you their money. They often become your best marketers, recommending you to friends, posting reviews, and championing your brand. That’s powerful, free advertising you just can’t buy.
You can easily track retention using your customer retention rate—the percentage of customers who stay with you over a given time period.
But if it’s low, what can you do to improve it?
At Interaction Metrics, our approach to increasing customer retention is informed by the real problem with most customer feedback surveys: they’re impersonal, ineffective, and often ignored. Unlike the typical survey approach, our surveys are built on three key principles: reciprocity, real listening, and scientific rigor.
If you’re ready to genuinely listen to your customers and turn their insights into lasting loyalty, contact us to learn more about how surveys built with our key principles in mind boost your customer retention. For specific strategies you can use, keep reading.

The Psychology Behind Retaining Customers
Now that you understand why customer retention matters, let’s take a step back and explore the psychology behind it. This is what allows you to build deeper connections and boost customer loyalty with your buyers.
At its core, customer retention taps into basic human nature. If you can understand what makes people tick, you can keep your customers loyal without breaking the bank.
First, let’s talk reciprocity. This is a way of saying that when you do something nice for your customers, they’re likely to do something nice in return.
It’s why your local ice cream shop offers you a free scoop after 10 visits. By rewarding you, they’re subtly encouraging you to keep coming back.
Then there’s social proof. People naturally follow the crowd. If everyone’s talking about a particular restaurant or a hot new product, you’ll probably want to check it out, too. Why? Because when you see 500 other people loving a product, you’re more likely to love it too, and stay loyal to the brand.
Finally, don’t underestimate emotional connection. Brands that make you feel something (like excitement, comfort, or belonging) are the ones you stick with. Think about why people line up for the latest Apple product. It’s not just technology; it’s about feeling part of something special.
When you understand these simple psychological principles, customer retention boils down to creating genuine connections and memories.
It’s about making customers feel valued, understood, and emotionally invested in your brand.
15 Proven Customer Retention Strategies
Below are 15 strategies that leverage these psychological principles to help you increase customer retention and turn you into an expert.
1. Personalize Customer Interactions to Boost Customer Satisfaction
Ever get a birthday email from your favorite store? Or have Amazon suggest a product that’s exactly what you wanted, even though you didn’t realize it yet?
That’s personalization in action. And it works.
People crave feeling seen and understood. When your brand takes the time to learn about each customer’s preferences, it feels special. It’s like the difference between getting a generic birthday card versus a handwritten note from your best friend.
Here are some easy ways you can personalize customer interactions:
- Use customer data to offer tailored recommendations (think Netflix’s personalized viewing suggestions).
- Address customers by name in emails and messages.
- Celebrate milestones like anniversaries or repeat purchases with personalized messages or special deals.
The more personal you get (without being creepy, of course), the stronger your customers’ emotional connection becomes.

2. Use Customer Feedback Effectively
Here’s the truth: most customer surveys are terrible, and most companies aren’t using them properly. You fill one out, send it off, and never hear about it again. That’s as ineffective as it is annoying and wastes your customers’ time.
But when done right, customer survey feedback is pure gold. It helps you spot problems early, seize opportunities, and shows customers you genuinely care about their experience.
At Interaction Metrics, we believe surveys must meet three key standards:
- Reciprocity: Respect your customers’ time by clearly showing that their feedback leads to actual improvements or rewards.
- Real Listening: Actively engage with customer responses, and don’t treat surveys as a one-way street.
- Scientific Rigor: Make sure your surveys aren’t biased and that your data is genuinely meaningful, not just flattering.
When customers see their feedback making a real difference, their loyalty grows exponentially. So, ditch the meaningless surveys. Instead, listen carefully, respond genuinely, and make changes based on what customers really want.
3. Create Exceptional Onboarding Experiences
Think about your first day at a new job. A warm welcome and clear guidance set you up to succeed.
The same idea applies to onboarding customers. First impressions really do matter. Use the tips below to create a smooth onboarding experience for every customer.
- Clearly guide new customers through their first interaction: Help customers feel comfortable by giving simple, clear steps during their first experience. Don’t assume they’ll figure it out—show them exactly what to do and where to go next.
- Use friendly check-ins to ask if they need help: Sending a quick email or chat message saying “How’s everything going?” shows you genuinely care. These brief touches make customers feel supported and heard.
- Anticipate common questions and provide proactive answers: Customers appreciate it when you proactively answer their questions before they even think to ask. It saves them time and makes you look attentive.
Slack does this exceptionally well. New users get clear, friendly prompts and helpful tips as they navigate the platform, ensuring they never feel overwhelmed or lost during their first interactions.

4. Deliver Prompt, Empathetic Customer Support
We’ve all had frustrating experiences with robotic customer support. Great customer support feels human: it’s fast, genuine, and personal.
When a company provides great customer service, this is how they do it:
- Respond fast—within hours, not days: Fast responses make customers feel respected and valued. Quick solutions reduce frustration and boost satisfaction significantly.
- Empower support teams to solve issues creatively: Allowing your team freedom means customers get faster solutions that solve their actual problems. Empowered employees create happier customers.
- Use real conversations, not scripts, to empathize genuinely: Genuine conversations build trust. Customers notice when you’re authentically engaged versus reading canned responses, and it makes a huge difference.
Zappos sets the standard by empowering their team to genuinely delight customers.
They’ve even sent pizzas to customers having a rough day—something customers remember and reward with continued loyalty.
5. Develop Reward and Loyalty Programs
Loyalty programs aren’t just about offering punch cards or reward points (although sometimes, they can be). They’re really meant to create excitement that keeps customers engaged.
There’s tons of room for creativity when you offer a loyalty program. Here are some common rewards models you can consider offering to your customers:
- Points-Based Rewards Programs: Points accumulate toward free or discounted items to motivate repeat business (Starbucks does this brilliantly through their My Starbucks Rewards program).
- Tiered Rewards: Customers earn status as they make more purchases. As their status increases, they unlock increasingly valuable perks. These incentivize them to stay loyal. Airlines and hotels use this strategy all the time.
- Surprise Rewards: Unexpected gifts, discounts, or bonuses create memorable experiences that customers can’t wait to take advantage of.
Loyalty programs work because they tap into the principles of psychology mentioned earlier. People love feeling special and rewarded. And when you build a good loyalty program, customers feel truly valued.

6. Provide a Seamless, Easy Customer Experience
The simplest truth about retaining customers is that it needs to be easy for them to buy. Really easy.
A confusing or frustrating experience sends customers running to competitors, no matter how good your product is.
Here’s how to make sure your customer experience is seamless:
- Keep your checkout process ridiculously simple: Customers want buying to be effortless. Amazon’s one-click checkout revolutionized online shopping because it removes friction.
- Clearly communicate your pricing, shipping, and return policies: Transparency builds trust. Customers appreciate clear information upfront, especially when it eliminates doubts and unpleasant surprises (like expensive return shipping) down the line.
- Regularly test your website or app for speed and ease of use: Small glitches cause frustration and lost sales. Regularly test your site to make sure it offers a smooth experience with as little friction as possible.
7. Make Returns and Refunds Easy and Transparent
Customers love a good return policy, but it’s also great marketing. It makes people confident to buy, knowing they won’t be trapped if things go wrong.
Make sure you offer a simple and transparent return policy. Here’s how:
- Clearly display your refund and return policies on your website: Customers should easily find and understand your policies. Clear communication removes anxiety about purchasing decisions.
- Make returns by providing prepaid shipping labels: Customers dread the hassle of returning items. But they hate the idea of having to pay for returns even more. Removing friction from returns earns loyalty and encourages repeat purchases.
- Process refunds quickly and communicate proactively: Quick refunds show buyers that you stand behind your products and are willing to work with them to make sure they’re satisfied customers.
Nordstrom built their entire reputation around easy returns, even accepting items without receipts. Customers return repeatedly because the process feels fair, easy, and respectful.

8. Build a Community Around Your Brand
More often than not, great brands have great communities behind them. Here’s how to create a community around your brand:
- Set up online spaces like groups, channels, or forums: Provide dedicated spaces where customers can engage, interact, and support one another. Connections with other users help customers understand everything your product or service is capable of, and make them reluctant to leave your brand.
- Host exclusive events, Q&A sessions, or live chats: Exclusive experiences create excitement and encourage customers to become active community members who feel like insiders. If you create high-quality content that offers lots of additional value, customers are more likely to stick around and take advantage of them.
Look at Peloton. They created a product, but they also built thriving communities where users can compete and interact with one another. Their customers stick around because they don’t want to lose access to the community.
9. Align Your Brand’s Values with Customers’ Values
Today’s customers choose brands that reflect their values. Taking clear, meaningful stands on issues your customers care about creates lasting emotional connections.
- Clearly communicate your brand’s values: When customers clearly see what you stand for, it helps them align their own values with your brand, fostering deeper loyalty. The about page of your website is a great place to do this.
- Back up messaging with genuine action: Customers quickly see through empty promises. If you say your company will do something, put your money where your mouth is. Actions that reflect your stated values show your customers you’re there to make a difference, not just a quick buck.
Patagonia does a great job of this. The company openly advocates for environmental causes and takes action their customers believe in. Customers who share those values passionately will continue to buy from Patagonia because they see alignment between their personal goals and the company’s.
10. Implement a Referral Program
Word-of-mouth marketing is just as effective (if not more effective) than advertising. Referral programs harness customer trust to create a self-sustaining cycle of growth and loyalty. Here are a few tips to implement your own referral program:
- Make referring simple (share buttons, referral codes): Simplify referrals so customers can actively promote your brand without feeling burdened by complex processes. Add one-click social media share options to product pages, blog posts, and press releases on your website.
- Offer compelling rewards for referrals: Motivating customers with meaningful incentives (discounts, perks) turns them into brand advocates. You can offer discounts, credits, or cold, hard cash rewards for referring friends and family.
- Regularly remind customers about the program in fun ways: Nobody can take advantage of a rewards program if they don’t know it exists. Send reminders via email to keep your program top-of-mind without being pushy, and watch as steady new referrals roll in.
Dropbox rapidly expanded by offering free storage to customers who referred friends. It’s easy, rewarding, and it motivates customers to continue referring friends and family to Dropbox.

11. Provide as Much Value as Possible
Customers keep returning to brands that consistently provide extra value. Offering more than just your product, like tips, insights, or education, creates deeper loyalty.
- Offer helpful guides, blogs, or videos: Practical resources enhance customers’ lives, making them appreciate your brand far beyond individual products. Create content that actively helps them solve the problems they’re facing right now.
- Share exclusive industry insights: Giving customers insider knowledge creates a feeling of privilege and reinforces their loyalty. Especially when it’s an actionable insight that helps them make more money.
Look at HubSpot as an example. They regularly publish valuable free resources, and customers use them all the time.
12. Offer Exclusive Deals and Early Access
Everyone loves feeling special. Exclusive offers or early access create excitement and foster customer loyalty by giving them something others don’t have.
Try providing early access to sales or products. Customers appreciate feeling like insiders who see things before everyone else.
You can also offer exclusive discounts for repeat customers. Special pricing not only incentivizes repeat business but also makes loyal customers feel rewarded and appreciated.
Finally, you can create limited-time, exclusive offers to build urgency. Urgency and exclusivity make offers feel exciting and special, and often push customers to take immediate action.
13. Celebrate Customer Successes and Milestones
Recognition strengthens relationships. Celebrating milestones like birthdays, anniversaries, or loyalty achievements makes customers feel valued personally. Here are a few ways your company can celebrate your customers:
- Send personalized messages or small gifts: Small gestures like personalized notes or tokens of appreciation create memorable connections.
- Publicly recognize loyal customers: Highlighting customers publicly (social media shoutouts, customer spotlights) makes them feel celebrated and recognized, fostering deeper loyalty.
- Reward loyalty milestones with surprises: Offering surprises for anniversaries or key milestones reminds customers how valued they truly are.
Spotify’s yearly “Wrapped” campaign is a great example of this. The program summarizes each user’s listening habits throughout the year and gamifies the listening experience. Users can see how much they listened to their favorite artists, how their tastes change throughout the year, and where they rank in each artist’s list of top listeners.
It’s a subtle yet powerful way to celebrate the time users spent listening in the app, but it also creates a sense of competition that makes them want to stick around for more.

14. Leverage Technology to Anticipate Customer Needs
Customers love it when brands anticipate their needs. It makes interacting with a company feel thoughtful and intuitive.
The easiest way to keep your customers feeling well cared-for is to use technology to predict their needs.
- Use analytics to predict future interests: Predictive analytics allows you to proactively suggest products or services, impressing customers with your insightfulness.
- Use CRM tools to identify churn risks early: Technology helps identify at-risk customers so you can proactively reach out and address concerns before they leave.
- Use automation to proactively offer help: Automated alerts or reminders can make your customer interactions feel personal and timely, and improve the overall experience for your customers.
Netflix is the perfect example. They use sophisticated algorithms to anticipate user preferences, which is what allows them to recommend movies you’ll love that you’ve never heard of!
15. Prioritize Employee Satisfaction
It’s simple: employees who feel valued and supported naturally provide better service and create stronger customer relationships.
In other words, happy employees create happy customers.
Invest in regular training and growth opportunities for your team. Employees who continuously learn and grow feel happier and provide better customer experiences.
For the same reason, you should empower your employees to solve problems independently. Reducing red tape and allowing your team autonomy to make customer-focused decisions improves service speed and customer satisfaction.
A great workplace culture makes employees feel valued, which translates directly into higher-quality customer experiences.
Key Metrics to Calculate Your Customer Retention
Before diving into the strategies, let’s get familiar with three key metrics that’ll show you exactly how well you’re doing when it comes to keeping customers happy.
Customer Retention Rate (CRR)
First up is the customer retention rate. This basically lets you calculate the number of customers you’re holding onto over a certain period.
Here’s the super-simple formula:
Customer Retention Rate = [(Customers at end of period – New customers during period) / Customers at start of period] × 100
Let’s say you started January with 100 customers, added 20 new ones, but ended the month with 90 customers total. Your retention rate would look like this:
(90 – 20) ÷ 100 × 100 = 70%
Not bad, right? Tracking your CRR regularly lets you see clearly if your retention strategies are working or if there’s room for improvement.
Customer Lifetime Value (CLV)
Next, we have customer lifetime value—or as we like to call it, “the big-picture metric.” CLV measures the total value each customer brings to your business during the entire time they’re your customer.
Here’s why CLV matters: Not all customers are equal. Some may spend small amounts often; others may spend big but rarely. Knowing your customers’ lifetime value helps you identify who your most profitable customers are—and how to keep them happy.
To calculate a simple version of CLV:
CLV = Average purchase value × Purchase frequency per year × Average customer lifespan
If your average sale is $50, your customers buy from you four times a year, and stick around for about five years, your CLV would be:
$50 × 4 × 5 = $1,000 per customer
This number shows why retention pays off: each customer you retain has a substantial long-term impact on your business.
Net Promoter Score (NPS)
Finally, let’s talk about Net Promoter Score. This score tells us, “How likely are your customers to recommend you to a friend?”
You’ve probably filled out a survey like this: “On a scale from 0 to 10, how likely are you to recommend us?”
Customers answering 9 or 10 are “promoters“—your biggest fans.
Those giving 7 or 8 are “passives” (indifferent), and anyone below that are “detractors,” who might even actively discourage others from buying from you.
Your NPS is calculated as:
NPS = % Promoters – % Detractors
A high NPS usually means you’re doing a great job keeping customers satisfied. A low NPS suggests something’s off, and it’s time to dive deeper into customer feedback.
By regularly tracking these three key metrics—Customer Retention Rate, Customer Lifetime Value, and Net Promoter Score—you’ll have a clear, actionable view of your retention efforts. And that’s how you set yourself up for success!
Next, we’ll explore specific, proven strategies to help you improve these metrics and turn more customers into lifelong fans. Ready? Let’s dive in!
Common Mistakes Companies Make When Trying to Retain Customers
Retention isn’t just about what you do right—it’s also about avoiding common pitfalls. Often, companies lose customers because they unintentionally overlook simple but critical factors.
Ignoring Customer Feedback
One of the biggest mistakes is ignoring customer feedback. When customers take the time to provide insights, failing to act—or even acknowledge their comments—sends a damaging message. It tells your customers that their opinions aren’t valued, leaving them feeling neglected. Showing genuine interest in their input, by contrast, builds trust and loyalty.
Sending Too Many Messages
Another common misstep is overwhelming customers with irrelevant or overly frequent communications. No one likes feeling bombarded. Sending customers constant emails, offers, or notifications that don’t align with their interests creates frustration and fatigue. Communication should feel thoughtful, personalized, and valuable—not generic or intrusive.
Treating Customers as Data Points
Finally, treating customers as transactions rather than as individuals damages retention significantly. Customers immediately sense when they’re viewed solely as a source of profit. Genuine, personal interactions strengthen relationships, creating an emotional connection that encourages ongoing loyalty.
Tools and Technologies to Help Increase Customer Retention
Improving your retention doesn’t require reinventing the wheel. Leveraging the right tools and technologies makes creating loyal customers simpler and more effective:
- CRM Software (Salesforce, HubSpot): CRM systems organize and manage customer interactions, allowing you to personalize communication effectively. You can track past purchases, preferences, and even predict future needs, all in one convenient location.
- Analytics Tools: Predictive analytics allow you to anticipate customer behavior and needs before they occur. Tools like Google Analytics or Mixpanel provide insights into how customers engage with your brand, empowering you to proactively address potential problems or opportunities.
- Interaction Metrics’ Scientifically Rigorous Surveys: Customer feedback surveys can dramatically enhance your retention—if they’re done correctly. Interaction Metrics creates surveys rooted in reciprocity, real listening, and scientific rigor. Unlike typical surveys, ours deliver actionable insights that genuinely improve your customer relationships.
Utilizing these tools equips you to understand your customers deeply and respond effectively, significantly boosting your customer retention.
How to Increase Customer Retention and Grow Your Business with Interaction Metrics
Boosting your customer retention is absolutely essential for long-term success. Keeping your existing customers engaged and happy directly translates into higher profits, lower churn, and sustained growth.
That’s where Interaction Metrics can help. Our scientifically rigorous surveys take customer feedback to the next level, providing clear, actionable insights that fuel loyalty and retention. Unlike ordinary surveys, ours are built on three essential standards: reciprocity, real listening, and robust, meaningful data.
If you’re ready to turn casual buyers into devoted customers, Interaction Metrics is your go-to partner. Let’s work together to create lasting relationships that grow your business sustainably and profitably. Schedule a call today to explore our scientifically designed surveys.
Frequently Asked Questions About Customer Retention
What exactly does customer retention refer to?
Customer retention refers to your ability to keep customers coming back after their initial purchase.
Why is customer retention important for businesses?
Customer retention matters because it’s cheaper and more profitable than constantly acquiring new customers.
What is considered a good customer retention rate?
Typically, anything above 70-80% is good, but it varies by industry. Improving your own historical rates matters most.
How can I accurately measure customer retention?
Use this formula:
(Customers at period end – New customers gained) ÷ Customers at period start × 100 = Retention Rate (%)
What factors lead to poor customer retention?
Poor customer service, unmet customer expectations, and not addressing complaints promptly all cause churn.
How does exceptional customer service impact retention?
Great service exceeds expectations, turning customers into repeat buyers and enthusiastic promoters.
Can customer education help improve customer retention?
Absolutely! Educated customers experience fewer frustrations, directly improving long-term satisfaction and loyalty.
What role does a strong customer community play in retention?
Community builds emotional connections, making customers reluctant to leave your brand.
How can mapping the customer journey help improve retention?
It lets you identify and fix points of friction, creating smoother, happier customer experiences.
=================================
Let’s discuss how to increase customer retention.
=================================
The post How to Increase Customer Retention: 15 Proven Strategies That Work appeared first on Interaction Metrics.
]]>Read more
The post Your Customer Feedback Dashboard: More Than Just a Pretty Face appeared first on Interaction Metrics.
]]>Your customer feedback dashboard is a powerful tool when used strategically. But dashboards are easy to underutilize and under-impress. Here’s our quick guide to getting the most out of your customer feedback dashboard.
Customer Feedback Dashboards: Strengths & Limitations
No doubt dashboards will make your business life easier but they do have some strengths and limitations worth considering.
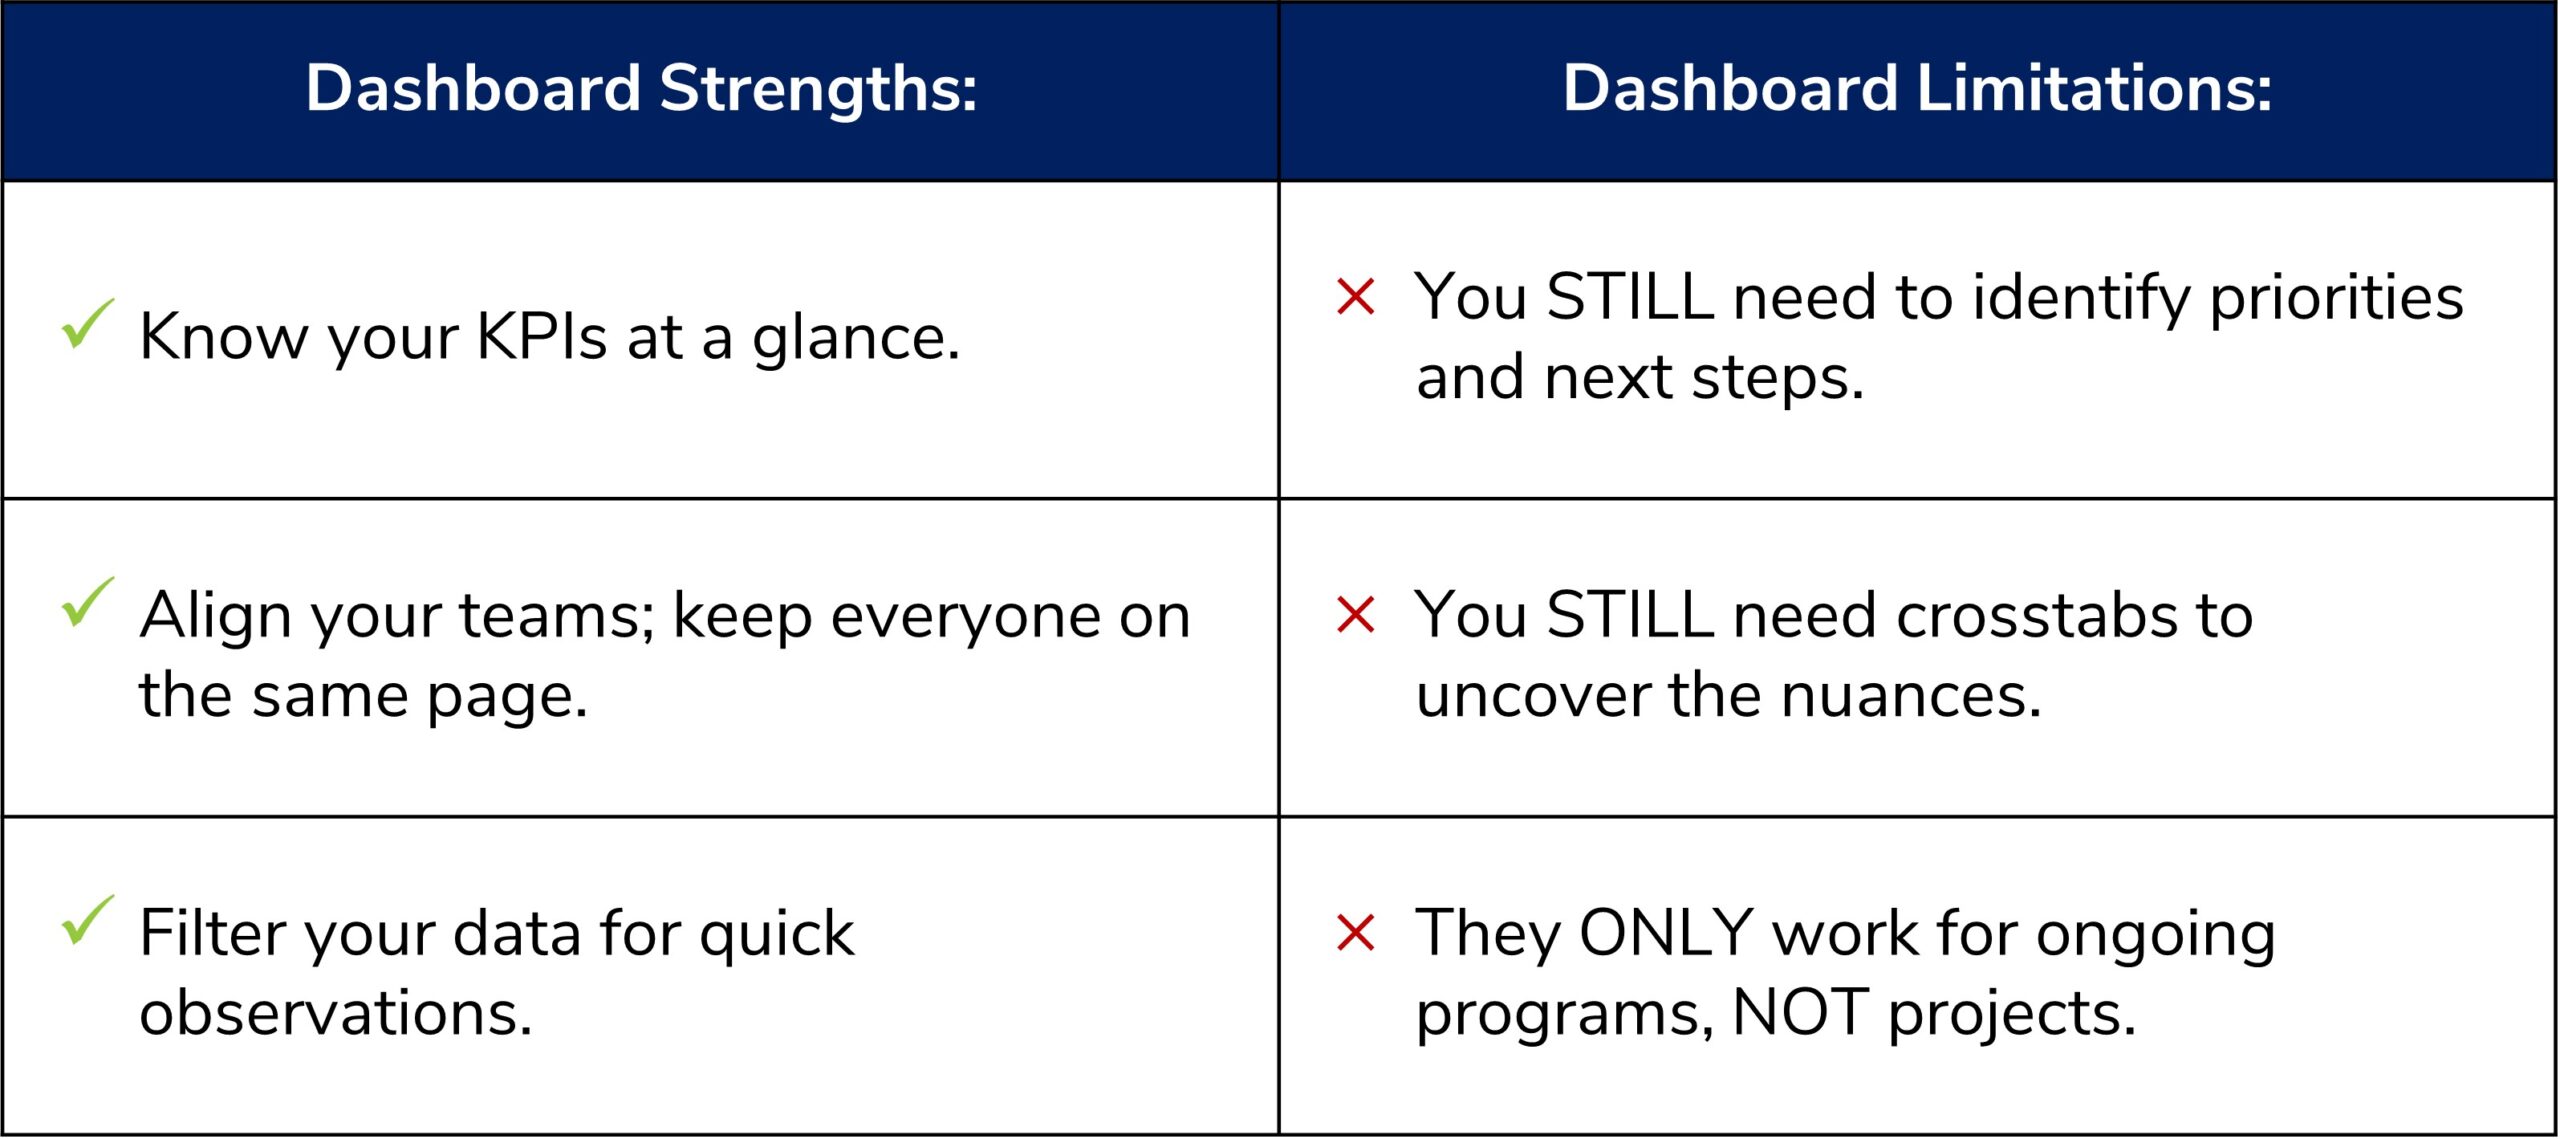
Dashboard Strengths:
- Know your KPIs at a glance.
- Align your teams; keep everyone on the same page.
- Filter your data for quick observations.
Dashboard Limitations:
- You STILL need to identify priorities and next steps.
- You STILL need crosstabs to uncover the nuances.
- They ONLY work for ongoing programs, NOT projects.
When Setting Up a Customer Feedback Dashboard
Of course, not all customer feedback dashboards are created equal. Here are a few things to look for when setting up yours:
- Seamless Integration: Make sure your dashboard integrates with your existing CRM systems and customer feedback channels. If it’s not connected to your data in real time, then it’s not any more useful than a PDF report.
- Customization: You need to be able to customize your dashboard to focus on the metrics that are most relevant to your goals.
- Alert System: Choose a dashboard that can alert you to significant changes in customer sentiment or unusual activity. This lets you respond quickly to potential crises or opportunities to earn customer loyalty.
To get maximum impact out of your dashboard, first choose the key metrics that matter most to you. Then, train your team to make sure everyone knows how to interpret and act on the dashboard data. Lastly, use the insights you gain from your dashboard to shape your strategy, whether improving customer service, enhancing product features, or tailoring your marketing.
Dashboards for NPS Tracking Studies
If you’re running an ongoing feedback program, a dashboard is essential for exploring your data quickly and efficiently.
A tracking study dashboard offers real-time visualizations of key metrics, like your Net Promoter Score, making it easy to spot emerging patterns and trends. You can compare different periods, identify issues, and seize opportunities as they arise.
Here’s how tracking study dashboards excel when continuous monitoring and quick pivots are necessary:
- Longitudinal Analysis: Tracking study dashboards allow you to monitor trends and measure the impact of the changes in your business.
- Segment Comparison: You can filter by criteria like market, product line, or demographics—allowing you to make specific adjustments.
- KPI Tracking: With real-time data, you can monitor key performance indicators (KPIs) like NPS, Customer Effort Score (CES), or Customer Satisfaction (CSAT) as they fluctuate.
![]()
This dashboard lets you filter by NPS Grouping, Team, Market Vertical, and Customer Type, so you can make meaningful comparisons across different customer segments and make informed decisions.
Dashboard for Interactive Text Analysis
Customer feedback dashboards commonly display business facts like survey scores or marketing progress. But one of the best (yet under-used) applications for a dashboard is tracking customers’ verbatim comments.
Customers’ open-ended comments often go ignored because it’s impossible to synthesize text by reading alone.
The solution is to implement robust Text Analysis that results in an Interactive Customer Feedback Dashboard.
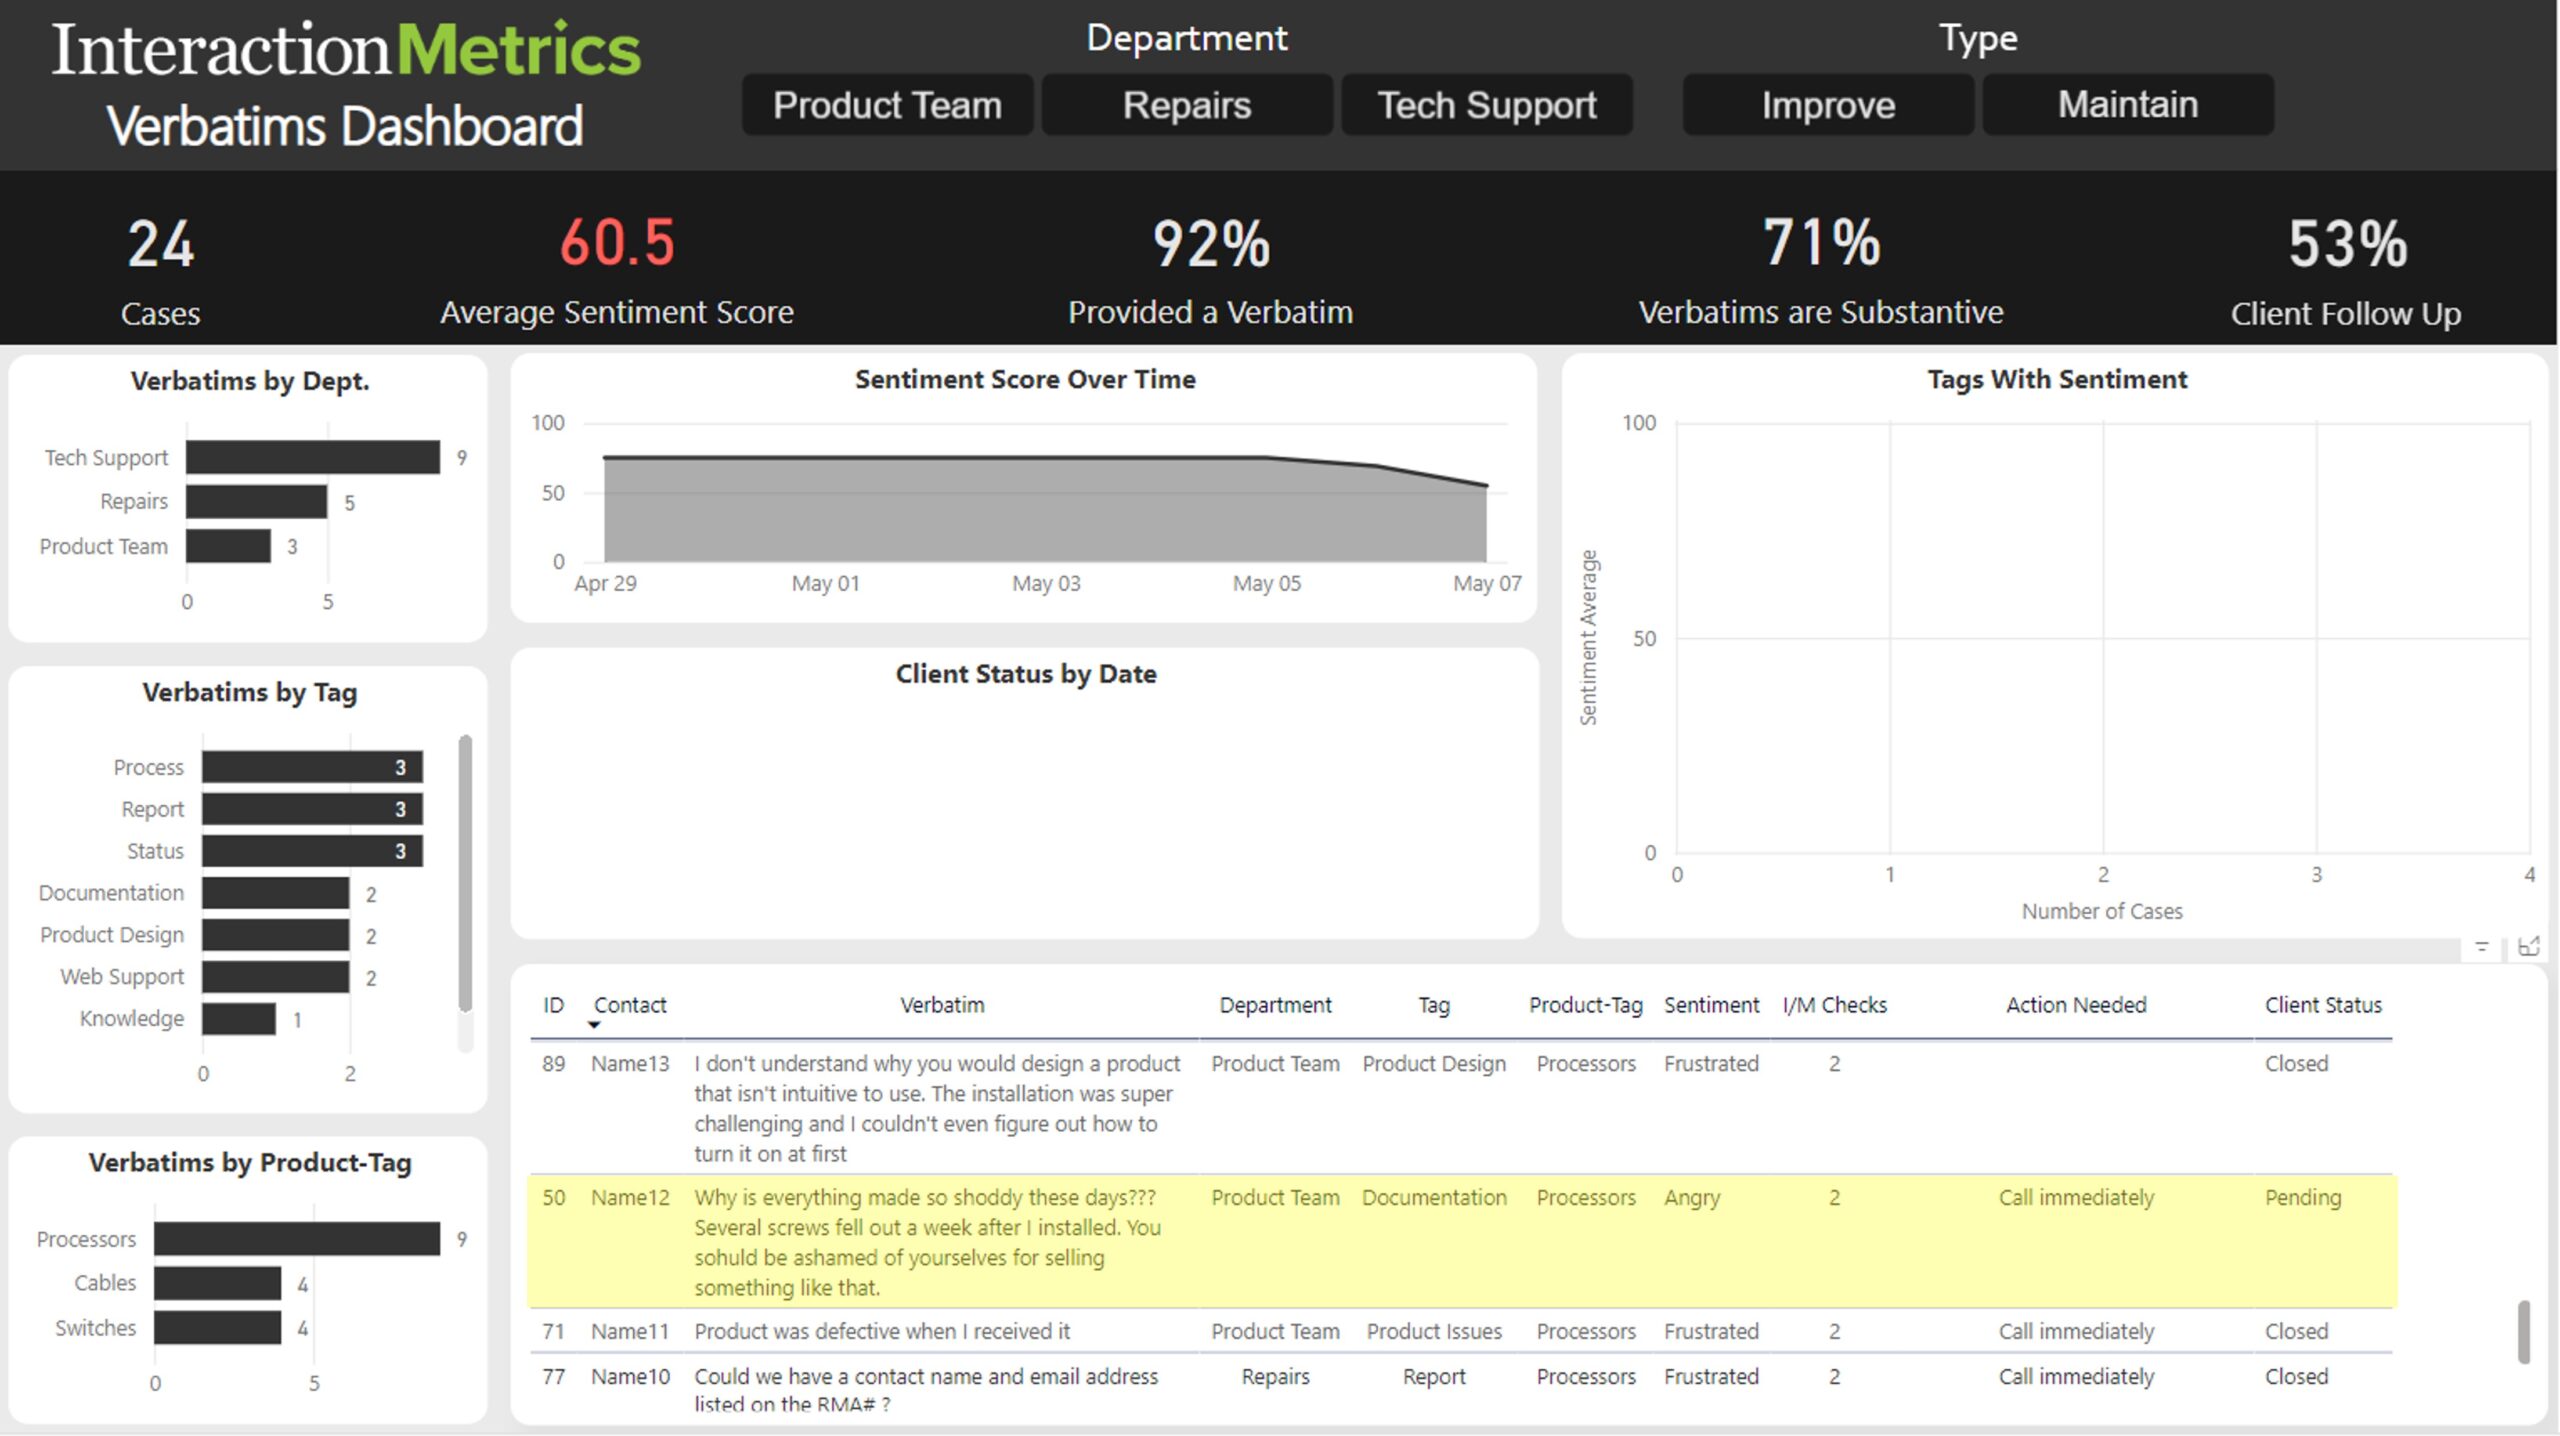
This dashboard has anonymized a few comments so you can see how this kind of dashboard works. Of course, your dashboard will probably have hundreds, if not thousands of customer comments.
It’s a true closed-loop system. You can access and review tagged customer verbatims and determine the actions you need to take–and show that they’ve taken them.
For example, ID 50 needs a callback immediately because they had difficulty installing the product due to poor product documentation. Now, you can use the filters on this dashboard to find that this case is still open and call the customer to resolve their issue.
Dashboards for Customer Service Monitoring
Customer feedback is critical for improving service quality, addressing issues quickly, and training staff. If your customer service team doesn’t have a customer feedback dashboard, getting one should be your top priority.
A Customer Service Dashboard gives your team the insights they need to deliver stellar service consistently. Here’s how:
- Real-Time Monitoring: Your team can see customer feedback as it comes in, allowing them to see what areas they can improve immediately.
- Trend Analysis: By analyzing feedback over time, you can identify recurring issues or emerging trends and look deeper into what needs to change.
- Team Performance Metrics: Dashboards can track individual and team performance metrics, informing specific training needs and goals.
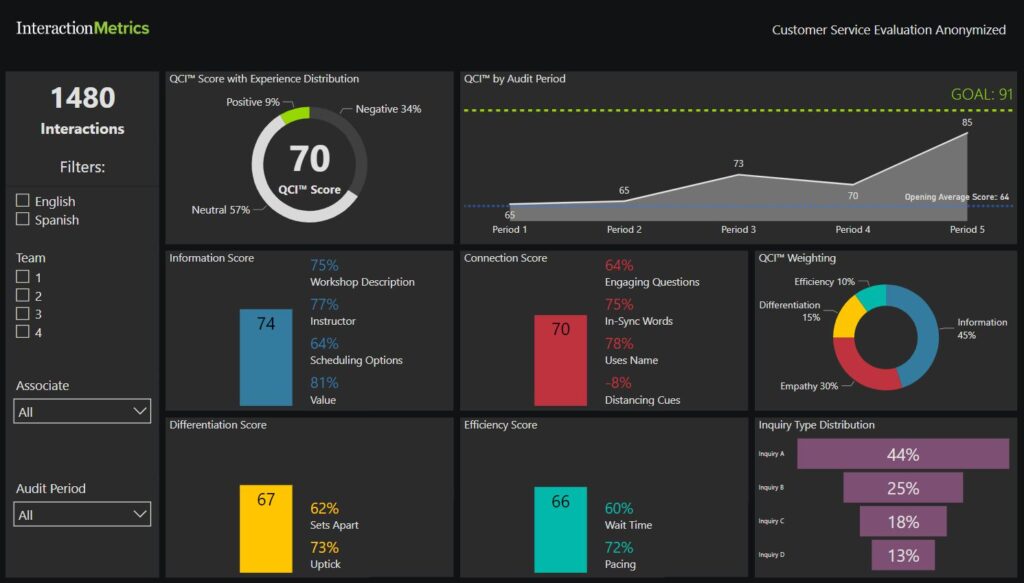
This dashboard shows how the client’s Customer Service Score breaks down into the four dimensions of customer service: Information, Connection, Differentiation, and Efficiency. This allows the client to focus on the dimensions that need improvement.
Other Departments Where a Customer Feedback Dashboard is a Good Fit
Not every department is a good fit for a customer feedback dashboard, and we’re not advocates for implementing unnecessary technology. But here are some departments where having a dashboard as a standard reference can align your team and goals.
- Product Development: User feedback should guide the development team on what features and improvements customers want most.
- Quality Assurance: Customer feedback can highlight bugs, usability issues, or areas that need improvement, guiding the QA team on what to focus on for testing.
- Inside Sales: Customer feedback lets sales teams identify sales approaches that resonate with customers and focus on effective selling points.
- Operations: Customer feedback can identify operational efficiencies, especially in areas directly impacting customer satisfaction, like shipping times, ease of returns, and communication clarity.
- User Experience (UX) Design: For teams focusing on products’ usability and design, customer feedback is essential for making user-focused improvements.
- Executive Leadership: Insights from customer feedback can inform strategic decisions, enabling leaders to align the company with customer needs and market demands.
Data-Driven Decisions Matter
Ultimately, a customer feedback dashboard is essential to any department that makes decisions based on customers’ perceptions. But skeptics might ask why collecting so much data from customers is necessary. Offhand observations should be sufficient to gauge customers’ thoughts, right?
Wrong! Any time a business decision is on the line, it should be backed by reliable data. One critical element to getting reliable data is making sure your sample size is large enough. Our sample size calculator will help you calculate how much data you need to collect for statistical significance. And of course, you want to consider whether your surveys could be skewed before they go live!
Lead with a Feedback Dashboard
Former Apple CEO Steve Jobs said, “Get closer than ever to your customers. So close that you tell them what they need well before they realize it themselves.”
A customer feedback dashboard lets you to get close to your customers, in a time when customers’ perceptions matter more than ever.
Moreover, with a comprehensive, real-time picture of customers’ thoughts and sentiments, you can align your strategies with customers’ needs.
============================================
Want to see how a customer feedback dashboard could benefit you? Get in touch!
============================================
The post Your Customer Feedback Dashboard: More Than Just a Pretty Face appeared first on Interaction Metrics.
]]>Read more
The post What Is Net Promoter Score (NPS) & Why Does It Matter? appeared first on Interaction Metrics.
]]>Last Updated: February 6, 2025
The Net Promoter Score (NPS) is the most well-known customer satisfaction metric used by two-thirds of the Fortune 1000 companies. But it’s also easy to misunderstand and misuse.
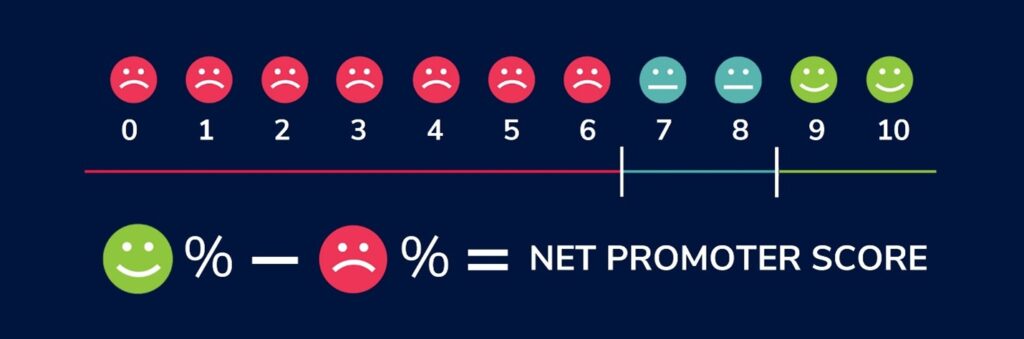
Created in 2003 by Fred Reichheld of Bain & Company, the Net Promoter System finds out: “How likely are you to recommend us to a friend or colleague?” Customers answer on a 0-10 scale. Then, the Net Promoter Score is the percent of promoters (9-10) minus the percent of detractors (0-6). That means if everyone rated you a 9 or a 10, your NPS would be 100! However, the average NPS Score is a far cry from 100; in fact, according to Survey Monkey, it’s 32 and varies widely by industry.
Imagine you run a local coffee shop. You’d want to know if your customers love your coffee enough to keep coming back and even tell their friends about it, right? That’s where the Net Promoter Score comes in. It’s like a popularity contest for businesses, but instead of votes, you get scores on how likely customers are to recommend your business to others.
The beauty of NPS is its simplicity. You ask one key question: “On a scale of 0 to 10, how likely are you to recommend us?”
Based on their answer, customers fall into three camps:
- Promoters (9-10): These are your superfans, the ones who not only come back but also bring their friends.
- Passives (7-8): They’re okay with your service but aren’t singing your praises from the rooftops.
- Detractors (0-6): These folks are unhappy customers. They might tell others to steer clear, signaling there’s work to be done.
Partnering with NPS Survey experts at Interaction Metrics ensures your NPS surveys are well-designed and scientifically analyzed to deliver the insights needed to drive meaningful improvements.
Here’s everything you need to know about NPS and why it matters.
Why Is NPS Important?
A high NPS means you’re doing something right; your customers are your advocates. A low score? It’s a red flag that people might be looking for the exit, or at least, they’re not sticking around to sing your praises.
Businesses use this score like a compass. It helps them gauge overall customer happiness, spot trends in brand perception, and pinpoint where they need to improve. By diving deeper into why people are promoters or detractors, companies learn what makes customers loyal or what’s pushing them away. Plus, by linking NPS with data like sales, how long customers stay, and how often they leave, businesses can see how happy customers translate into dollar signs.
Industries such as retail, hospitality, financial services, and technology frequently rely on NPS to gauge customer sentiment. For companies in competitive markets, tracking NPS trends can provide a significant advantage, allowing them to adjust their customer experience efforts in real time to maintain or improve loyalty.
How to Calculate Net Promoter Score (Step by Step)
Calculating your Net Promoter Score is like baking a simple cake – follow the recipe, and you’ll have your answer. Here’s the straightforward method
Step 1. Ask the Magic Question: You only need to pose one question to your customers: “On a scale from 0 to 10, how likely are you to recommend our product or service to a friend or colleague?”
Step 2. Sort the Answers: Based on their responses, customers fit into one of three groups. Promoters (individuals who score 9-10) are your brand evangelists. Passives (people who score 7-8) are neither here nor there. Detractors (people who score 0-6) are the ones who might be warning others not to work with your company.
Step 3. Do the Math: Here’s where it gets a bit like mixing ingredients. Subtract the percentage of Detractors from the percentage of Promoters. That’s your NPS.
If 50% are Promoters and 10% are Detractors, your NPS is 50 – 10 = 40.
The final Net Promoter Score calculation can be performed using this formula:
NPS = (% of Promoters) – (% of Detractors)
As another example, if 60% of respondents are Promoters, 25% are Passives, and 15% are Detractors, the calculation would be:
60% – 15% = 45 (NPS)
What Is a Good NPS Score?
A good Net Promoter Score depends on your industry and customer expectations. NPS scores range from -100 to 100, with higher scores indicating stronger customer loyalty. However, what qualifies as a “good” score varies by sector and business model.
Industry Benchmarks
Different industries naturally produce different NPS benchmarks.
Luxury brands and hospitality often have high NPS, sometimes reaching 70 or higher, as personalized service and premium experiences drive customer loyalty.
Retail and e-commerce companies tend to have mid-range scores, typically between 30-50, depending on product quality and customer service.
Telecommunications and financial services often see lower scores, sometimes between 0-30, due to higher customer expectations and frequent service-related complaints.
Companies should benchmark their NPS against competitors within their industry rather than comparing themselves to unrelated businesses.
What Qualifies as a Strong, Average, or Weak NPS Score?
Excellent scores range from 70-100. This indicates very high customer loyalty and strong word-of-mouth recommendations.
Good scores range from 50-69. A score that falls in this range is solid, and indicates enthusiastic customers who are likely to promote the brand.
Average scores range from 30-49. These indicate mixed customer sentiment; some customers are promoters, but there are also a notable number of passives and detractors.
Poor scores range from 0-29. Scores that fall in this range signal customer dissatisfaction and potential churn risk. Companies in this range should focus on improving customer experience and addressing concerns raised by detractors.
Negative scores range from -100 to -1. Negative scores are major red flags indicating widespread customer dissatisfaction that requires urgent action.
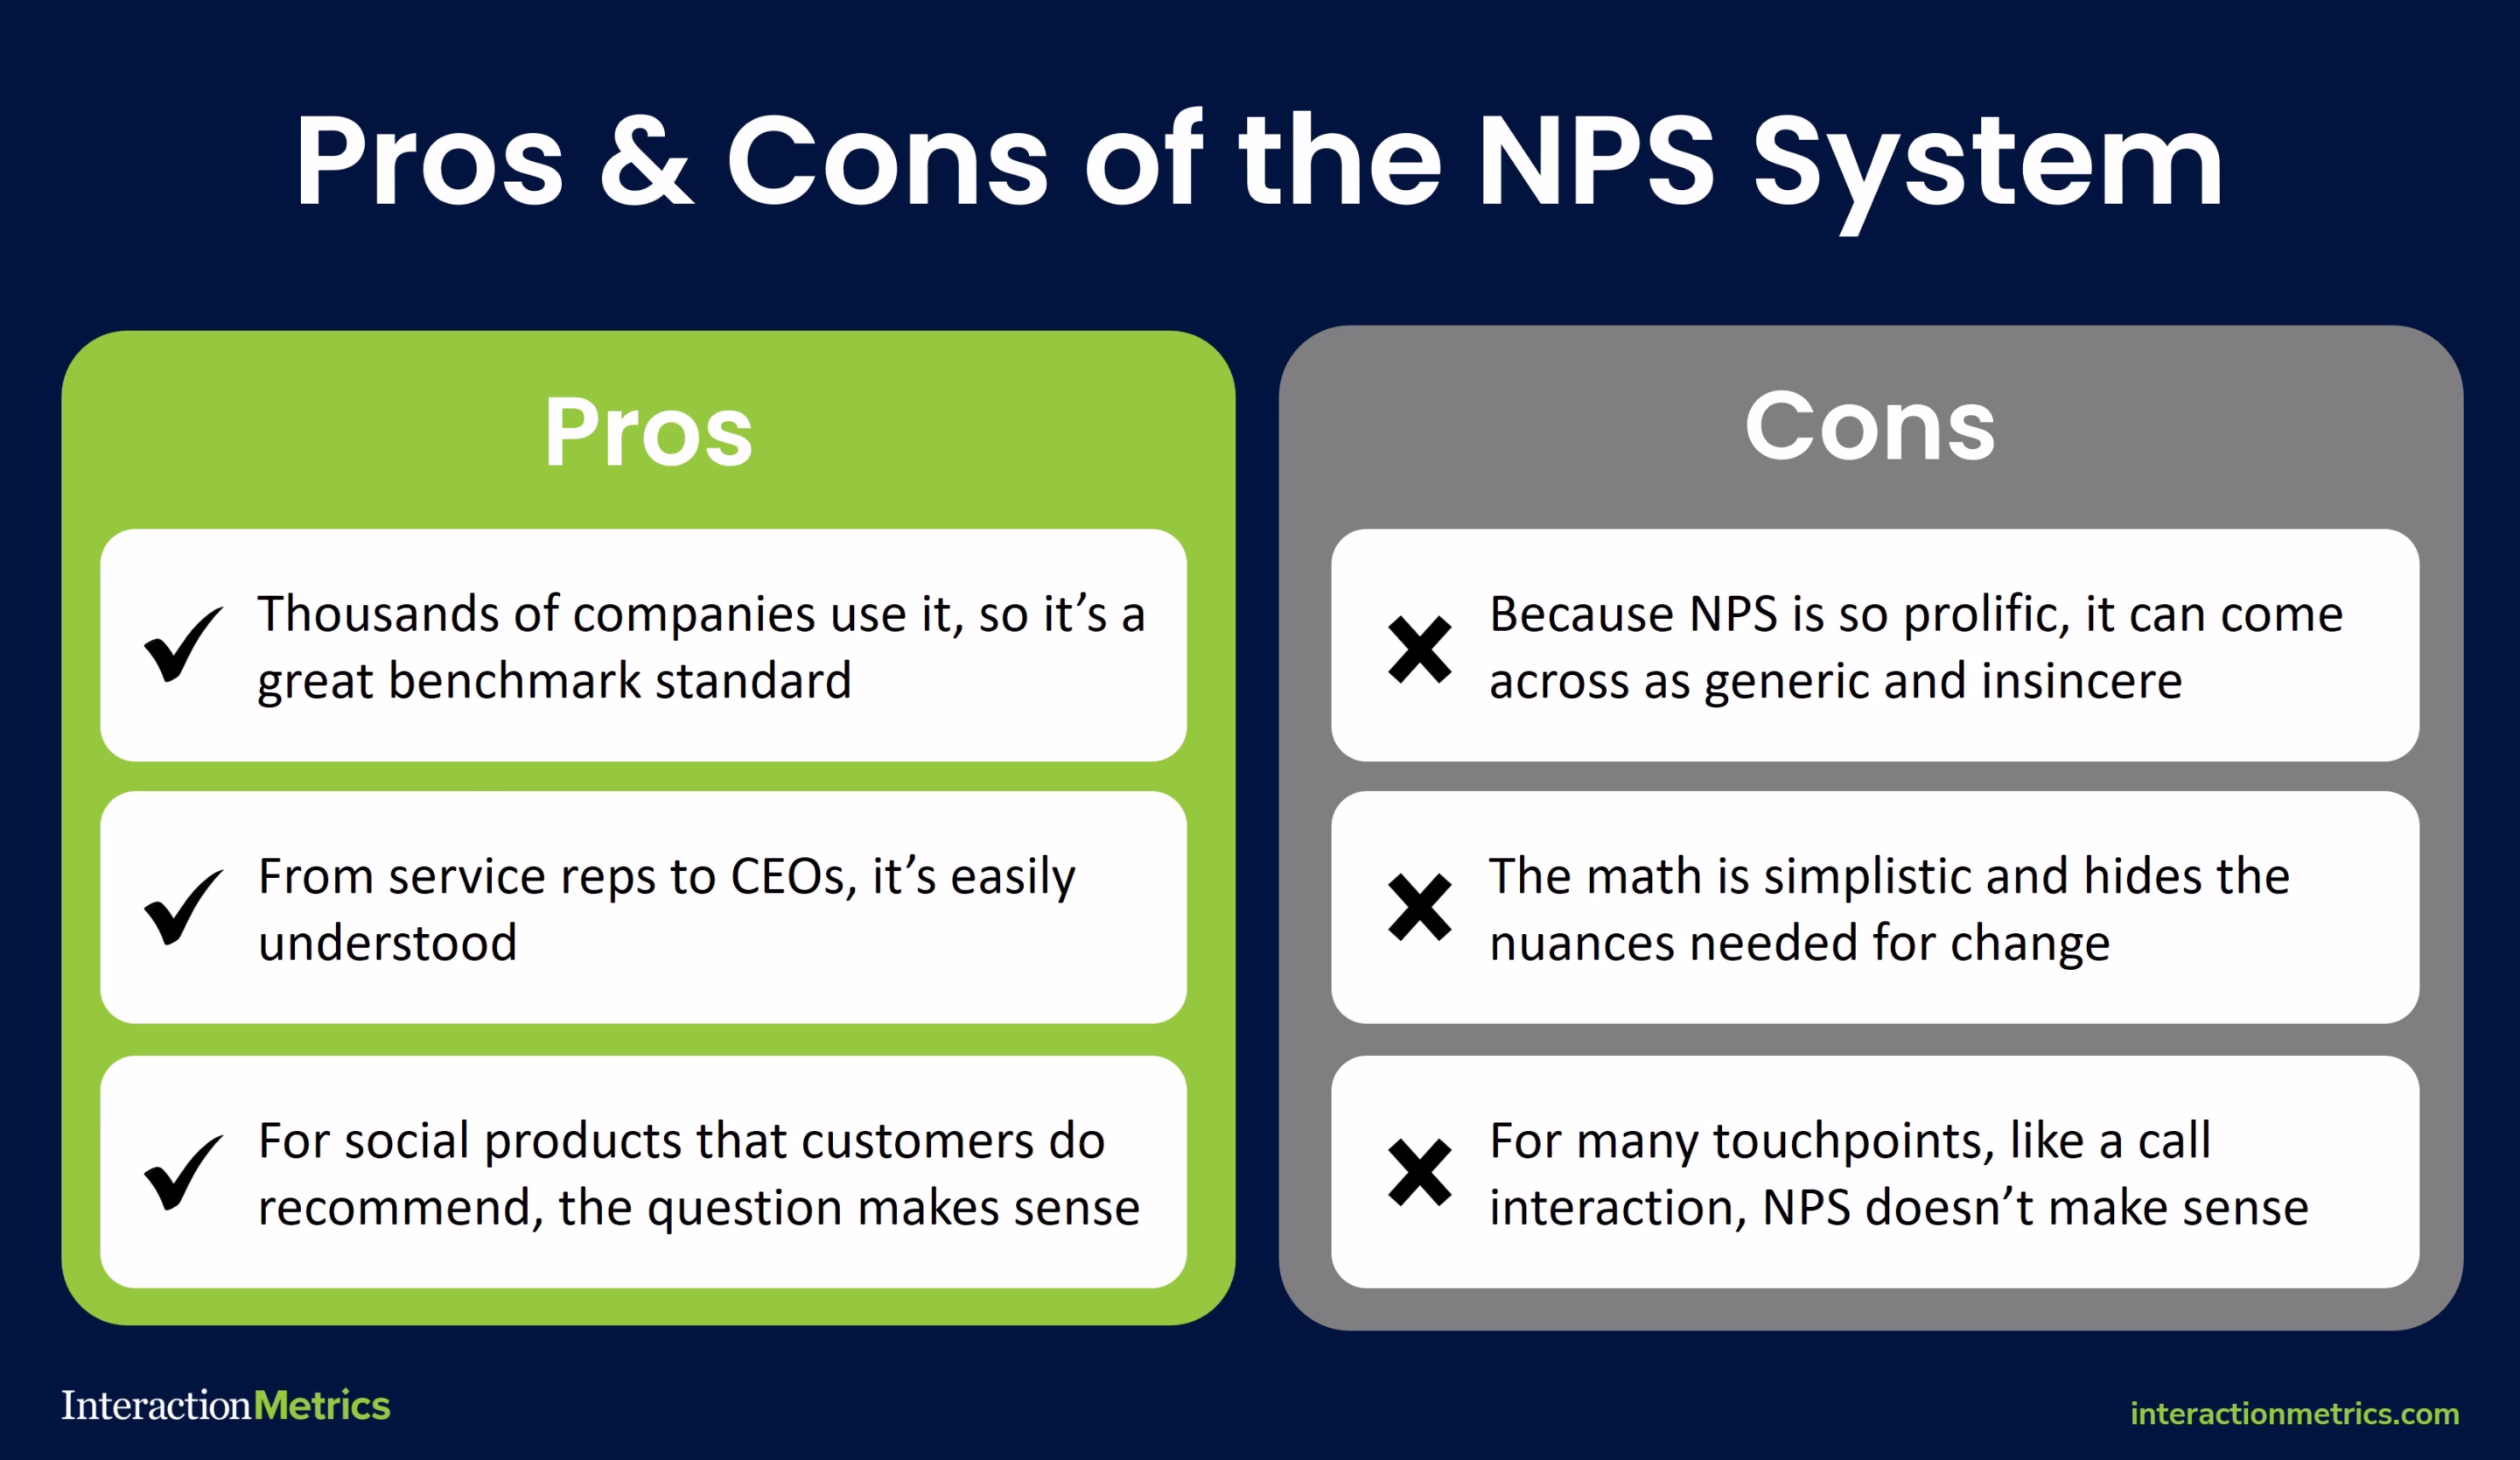
The Pros & Cons of the NPS System
The Net Promoter Score is easy to figure out and understand. It’s useful for businesses because it asks customers how likely they are to suggest the product or service to their friends, focusing on their social behavior.
But the Net Promotor Score has its drawbacks too. Here are a few:
- Given the popularity of the Net Promoter Score (NPS), companies can appear insincere when they ask the NPS question. Customers are so used to answering the NPS question that they may assume a company is not genuinely interested in what they have to say.
- The NPS categorizes all scores between a 0 and a 6 into a single category of detractors, but that’s a wide range in customer sentiment that’s worth breaking down.
- The Net Promoter question may not be a great fit for every company or every situation. For example, specialty manufacturers can provide an excellent customer experience, and yet it’s unlikely customers would recommend these kinds of companies to their friends or even necessarily their colleagues.
- The Net Promoter question does not work for all customer experience touchpoints, like website navigation or product packaging. Nevertheless, these touchpoints are critical to the customer’s experience.
- Finally, the Net Promoter Score does not include a weighting factor to reflect the relative importance of various aspects of the customer experience.
With these considerations in mind, it’s important to ask whether the NPS question is the right fit for your company. Does the metric match your company’s objectives?
In certain industries, customers aren’t likely to recommend companies to their peers at all, no matter what their satisfaction level might be. That’s why the Net Promoter Score is generally best for companies in industries where customers are likely to recommend them, such as luxury hotels or restaurants.
More broadly, it’s never enough to simply send an NPS survey. Instead, you need to optimize the Net Promoter question with a follow-up strategy to ensure customers feel heard and you have the insights you need to move your company forward.
How to Collect NPS Feedback
Whether you conduct NPS Surveys monthly, quarterly, or annually, aim to gauge customer sentiment toward your company as a whole. Periodic assessments will help you monitor your customer health and establish net promoter score benchmarks for your company’s success.
While some companies use NPS after transactions like product delivery or customer service interactions, the question isn’t suited to that.
After all, customers don’t recommend you based on one event. Instead, your customers will recommend you (or not) because of their overall experience from start to finish and over time.

Survey Collection Methods
Choosing the right method for collecting NPS feedback is the key to obtaining accurate and actionable insights. Businesses can gather responses through various channels, each with its advantages and considerations.
Email Surveys
Email surveys are one of the most common and effective ways to collect NPS data. They allow businesses to reach a broad audience while providing customers with the flexibility to respond at their convenience.
Best practices for email surveys:
- Keep the subject line short and clear to encourage higher open rates.
- Personalize the email with the recipient’s name or relevant details.
- Send the survey within an appropriate time frame—such as shortly after a key customer interaction—to capture relevant feedback.
- Follow up with non-responders to increase response rates.
Website Pop-Up Surveys
Website pop-up surveys collect feedback from customers while they are actively engaging with a business’s website or platform. These surveys are especially useful for capturing sentiment about user experience, navigation, or an ongoing transaction.
Best practices for website pop-up surveys:
- Trigger surveys at the right time (e.g., after checkout, upon exit intent, or after a specific interaction).
- Keep the survey brief—customers are more likely to engage with one or two quick questions.
- Ensure the pop-up is not intrusive or disruptive to the user experience.
SMS Surveys
SMS surveys enable businesses to collect feedback quickly and efficiently via text messages. These surveys tend to have higher open rates compared to email and are particularly effective for gathering feedback after a service interaction or purchase.
Pros and cons of SMS surveys:
 High open and response rates compared to email surveys.
Easy to deploy and reach mobile users.
 Limited space for detailed questions.
Can be perceived as intrusive if not timed appropriately.
Phone Interviews
Phone interviews provide an opportunity for businesses to collect detailed feedback directly from customers. These surveys are best suited for high-value customers or situations where additional context is needed.
When to use phone interviews:
- When you need deeper qualitative insights beyond the NPS.
- When working with B2B clients or high-value customers who require personalized engagement.
- When addressing concerns from detractors to improve retention and loyalty.
By selecting the right survey method for their audience, businesses can ensure they gather reliable and meaningful NPS data that leads to actionable improvements.
Best Practices for Collecting Accurate NPS Data
Collecting Net Promoter Score data takes thoughtful planning to make sure results are accurate, meaningful, and actionable.
Following these best practices can help you maximize the value of your NPS surveys.
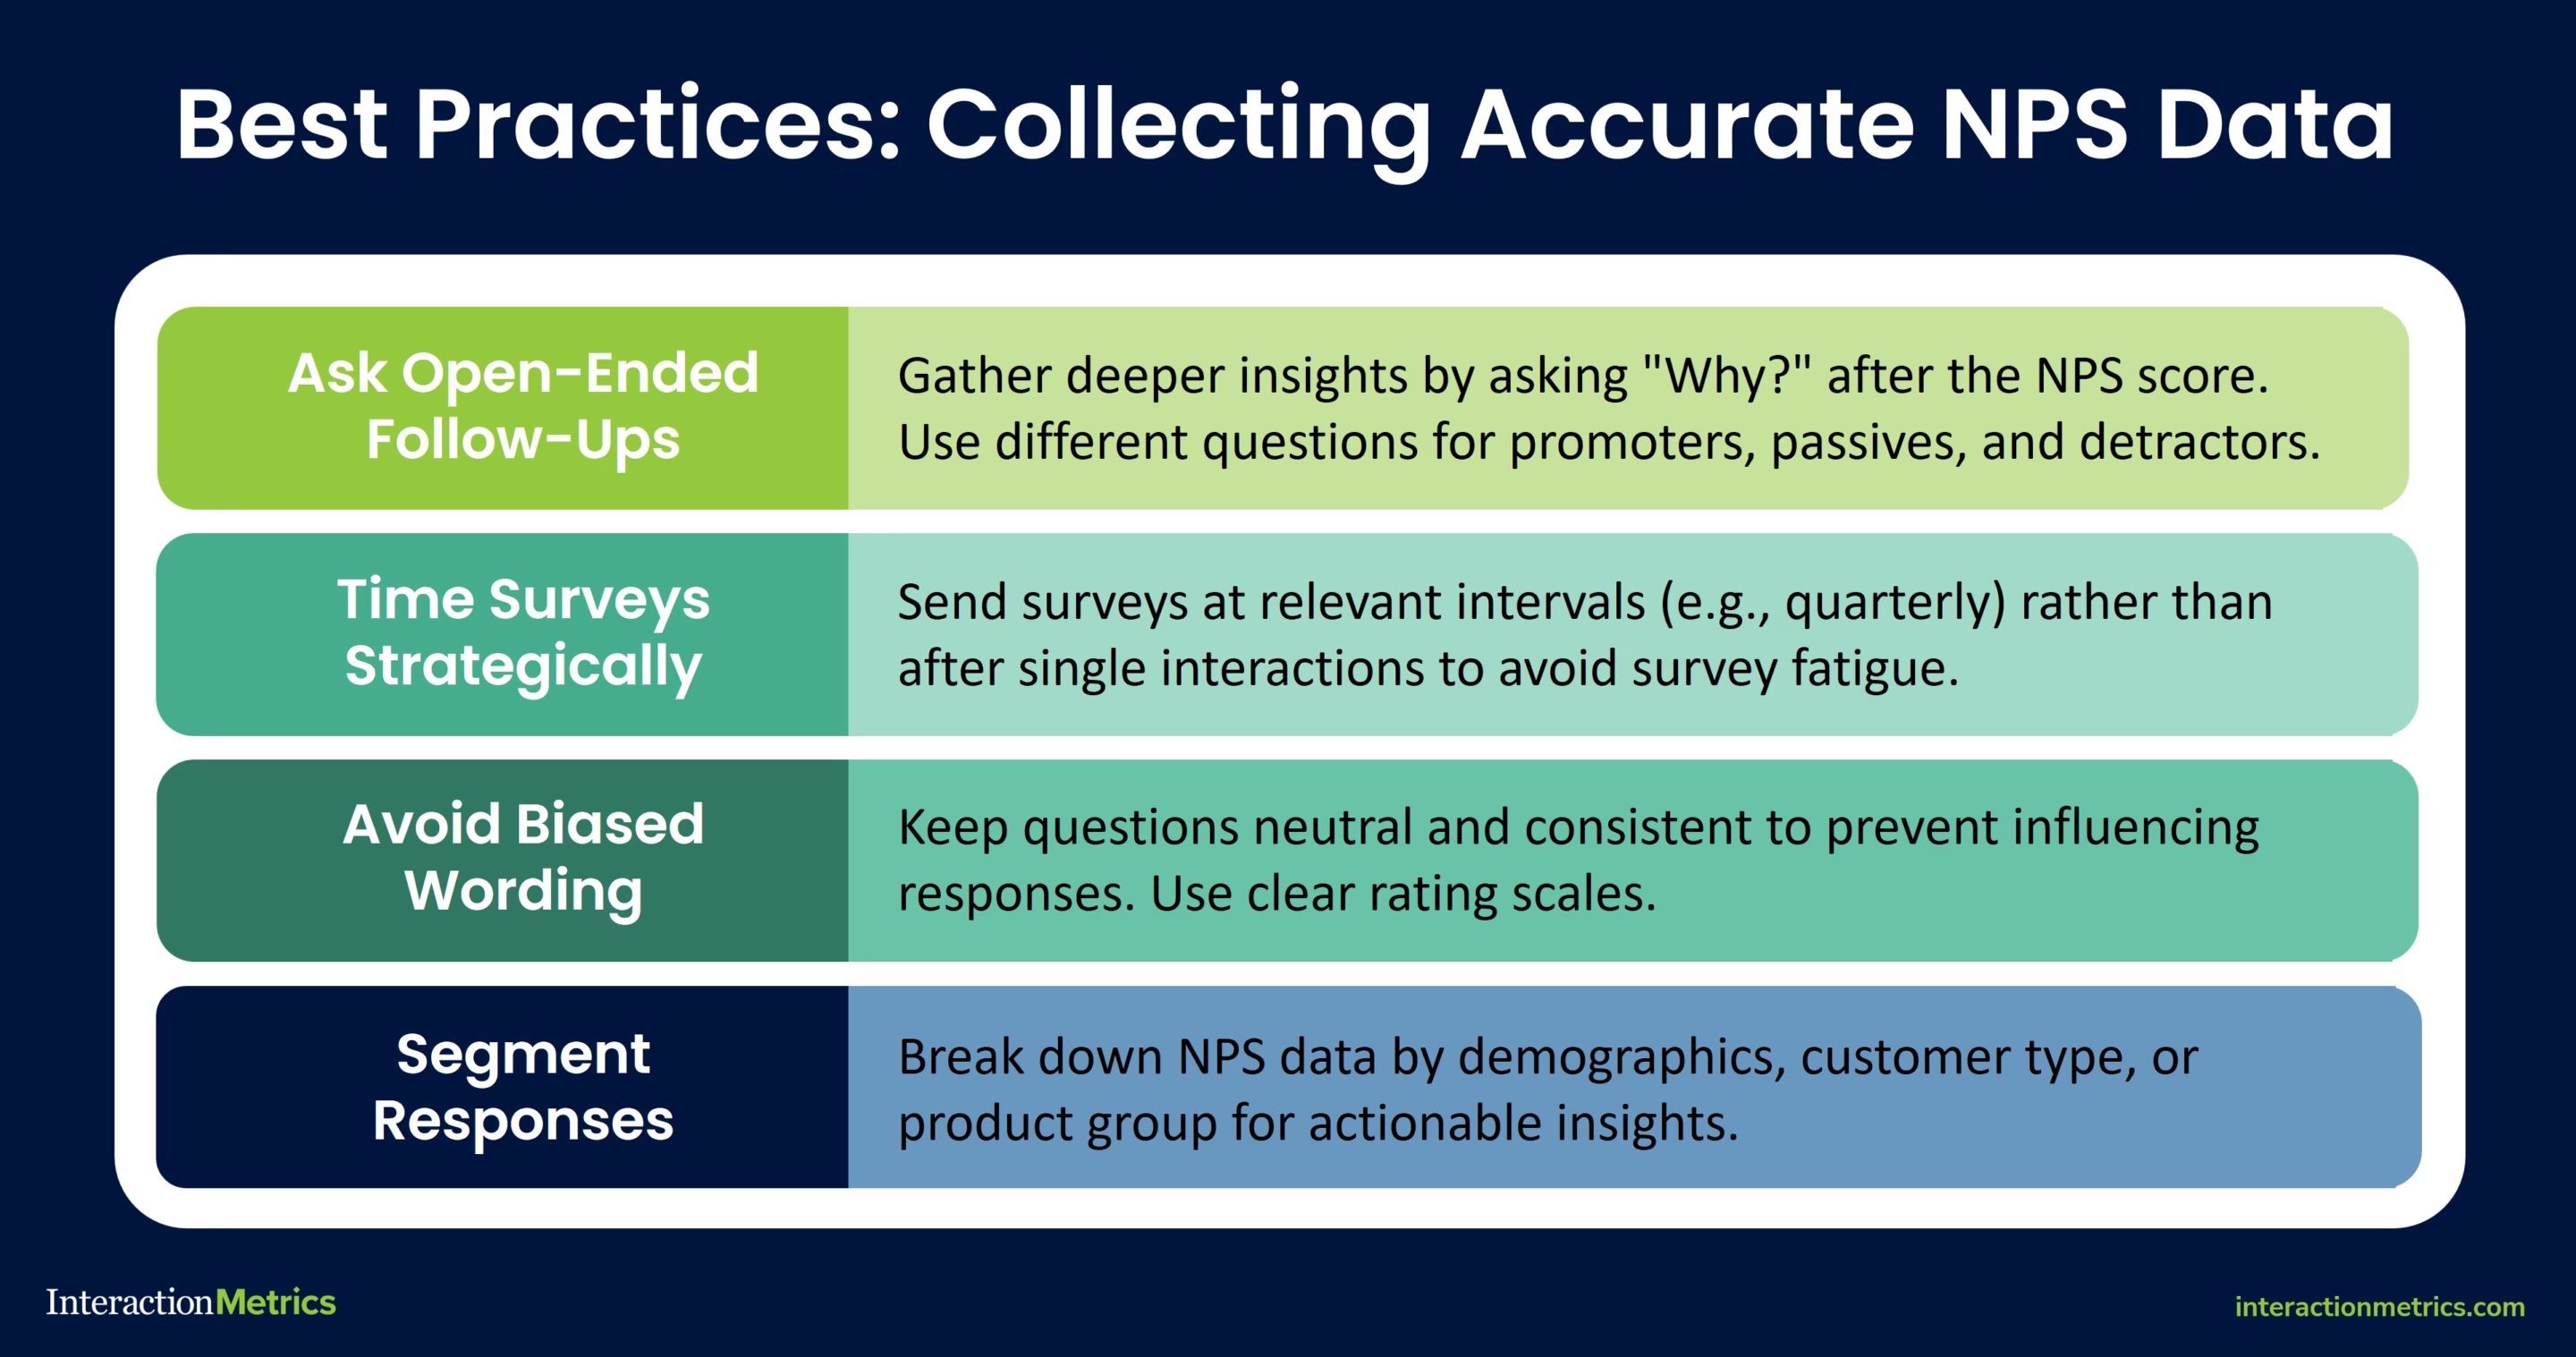
Ask Open-Ended Follow-Up Questions
While the NPS question provides a numerical score, it does not explain why customers feel the way they do.
Including an open-ended follow-up question—such as “How could CompanyABC improve?”—helps businesses uncover key drivers behind customer sentiment.
You can also use survey logic to ask different follow-up questions to promoters and detractors.
For example, you might ask promoters “What would make your experience with CompanyABC even better?”
For passives and detractors, you may want to ask something like “What challenges have you had while working with CompanyABC?”
This qualitative feedback provides deeper insights that a numerical score alone cannot offer, which lets companies take targeted action to improve the customer experience.
Time Surveys for Maximum Response Rates
Survey timing plays a critical role in gathering useful responses.
When a company asks a customer to take a survey, they are asking for the customer’s time, insights, and effort. That time should be honored with a form of reciprocity.
This could mean offering a tangible incentive, such as a discount or reward, but more importantly, it means showing customers that their feedback leads to meaningful outcomes.
Without this mutual exchange, surveys become extractive—a one-sided demand rather than an invitation to co-create a better experience.
Businesses should always respect their customers’ time, and send NPS surveys.
That means you shouldn’t send an NPS survey shortly after key interactions (e.g., after a purchase, service experience, or customer support call) to capture fresh, relevant feedback.
Think about it, and it makes sense: most people wouldn’t recommend a company to a friend based on their experience during a single phone call.
Instead, most people would recommend a company after working with them for an extended period of time. This is why sending NPS surveys at strategic intervals (e.g., quarterly or bi-annually) to track trends over time is a better strategy.
It’s also important to avoid survey fatigue, meaning you should avoid sending “survey spam.” Sending surveys too frequently to the same customers can leave them frustrated, cause lower response rates, and skew data.
Avoid Leading Questions That Create Biased Responses
The way questions are worded can unintentionally influence how customers respond. For objective results:
- Keep the wording neutral—avoid overly positive or negative phrasing that may push respondents toward a certain answer.
- Make sure the survey uses a consistent structure for all customers. This minimizes variations in responses that may happen due to the order of questions or their context.
- Provide clear, easy-to-understand rating scales so that customers know exactly how their responses are being interpreted.
Segment NPS Data for Deeper Insights
Segmenting your NPS by demographics, customer categories, or product groupings is necessary to glean actionable customer insights.
Without these segmentations, you will probably be at a loss for what actions to prioritize and which next steps to take.
So, while you might report one aggregate score, practically speaking, you will work with several scores.
Analyzing results by customer type, demographics, or product usage can unveil hidden trends in customer sentiment.
For example, different product lines may generate significantly different scores. This could indicate that some offerings are better received than others.
Similarly, customer segments based on location, age, or business size might display clear loyalty patterns that can help refine marketing and customer service strategies.

Track NPS Over Time
Tracking NPS trends over time is just as important as segmenting by customer type. A single score provides a snapshot, but monitoring changes over months or years can highlight whether initiatives to improve customer satisfaction are working.
If scores are declining, it signals the need for immediate intervention.
We recommend using a dashboard like the interactive example below to monitor NPS over time. It lets you filter by NPS Grouping, Team, Market Vertical, and Customer Type, so you can make meaningful comparisons across different customer segments and make informed decisions.
If specific segments of customers consistently provide lower scores, companies can focus on improving those interactions to enhance overall satisfaction.
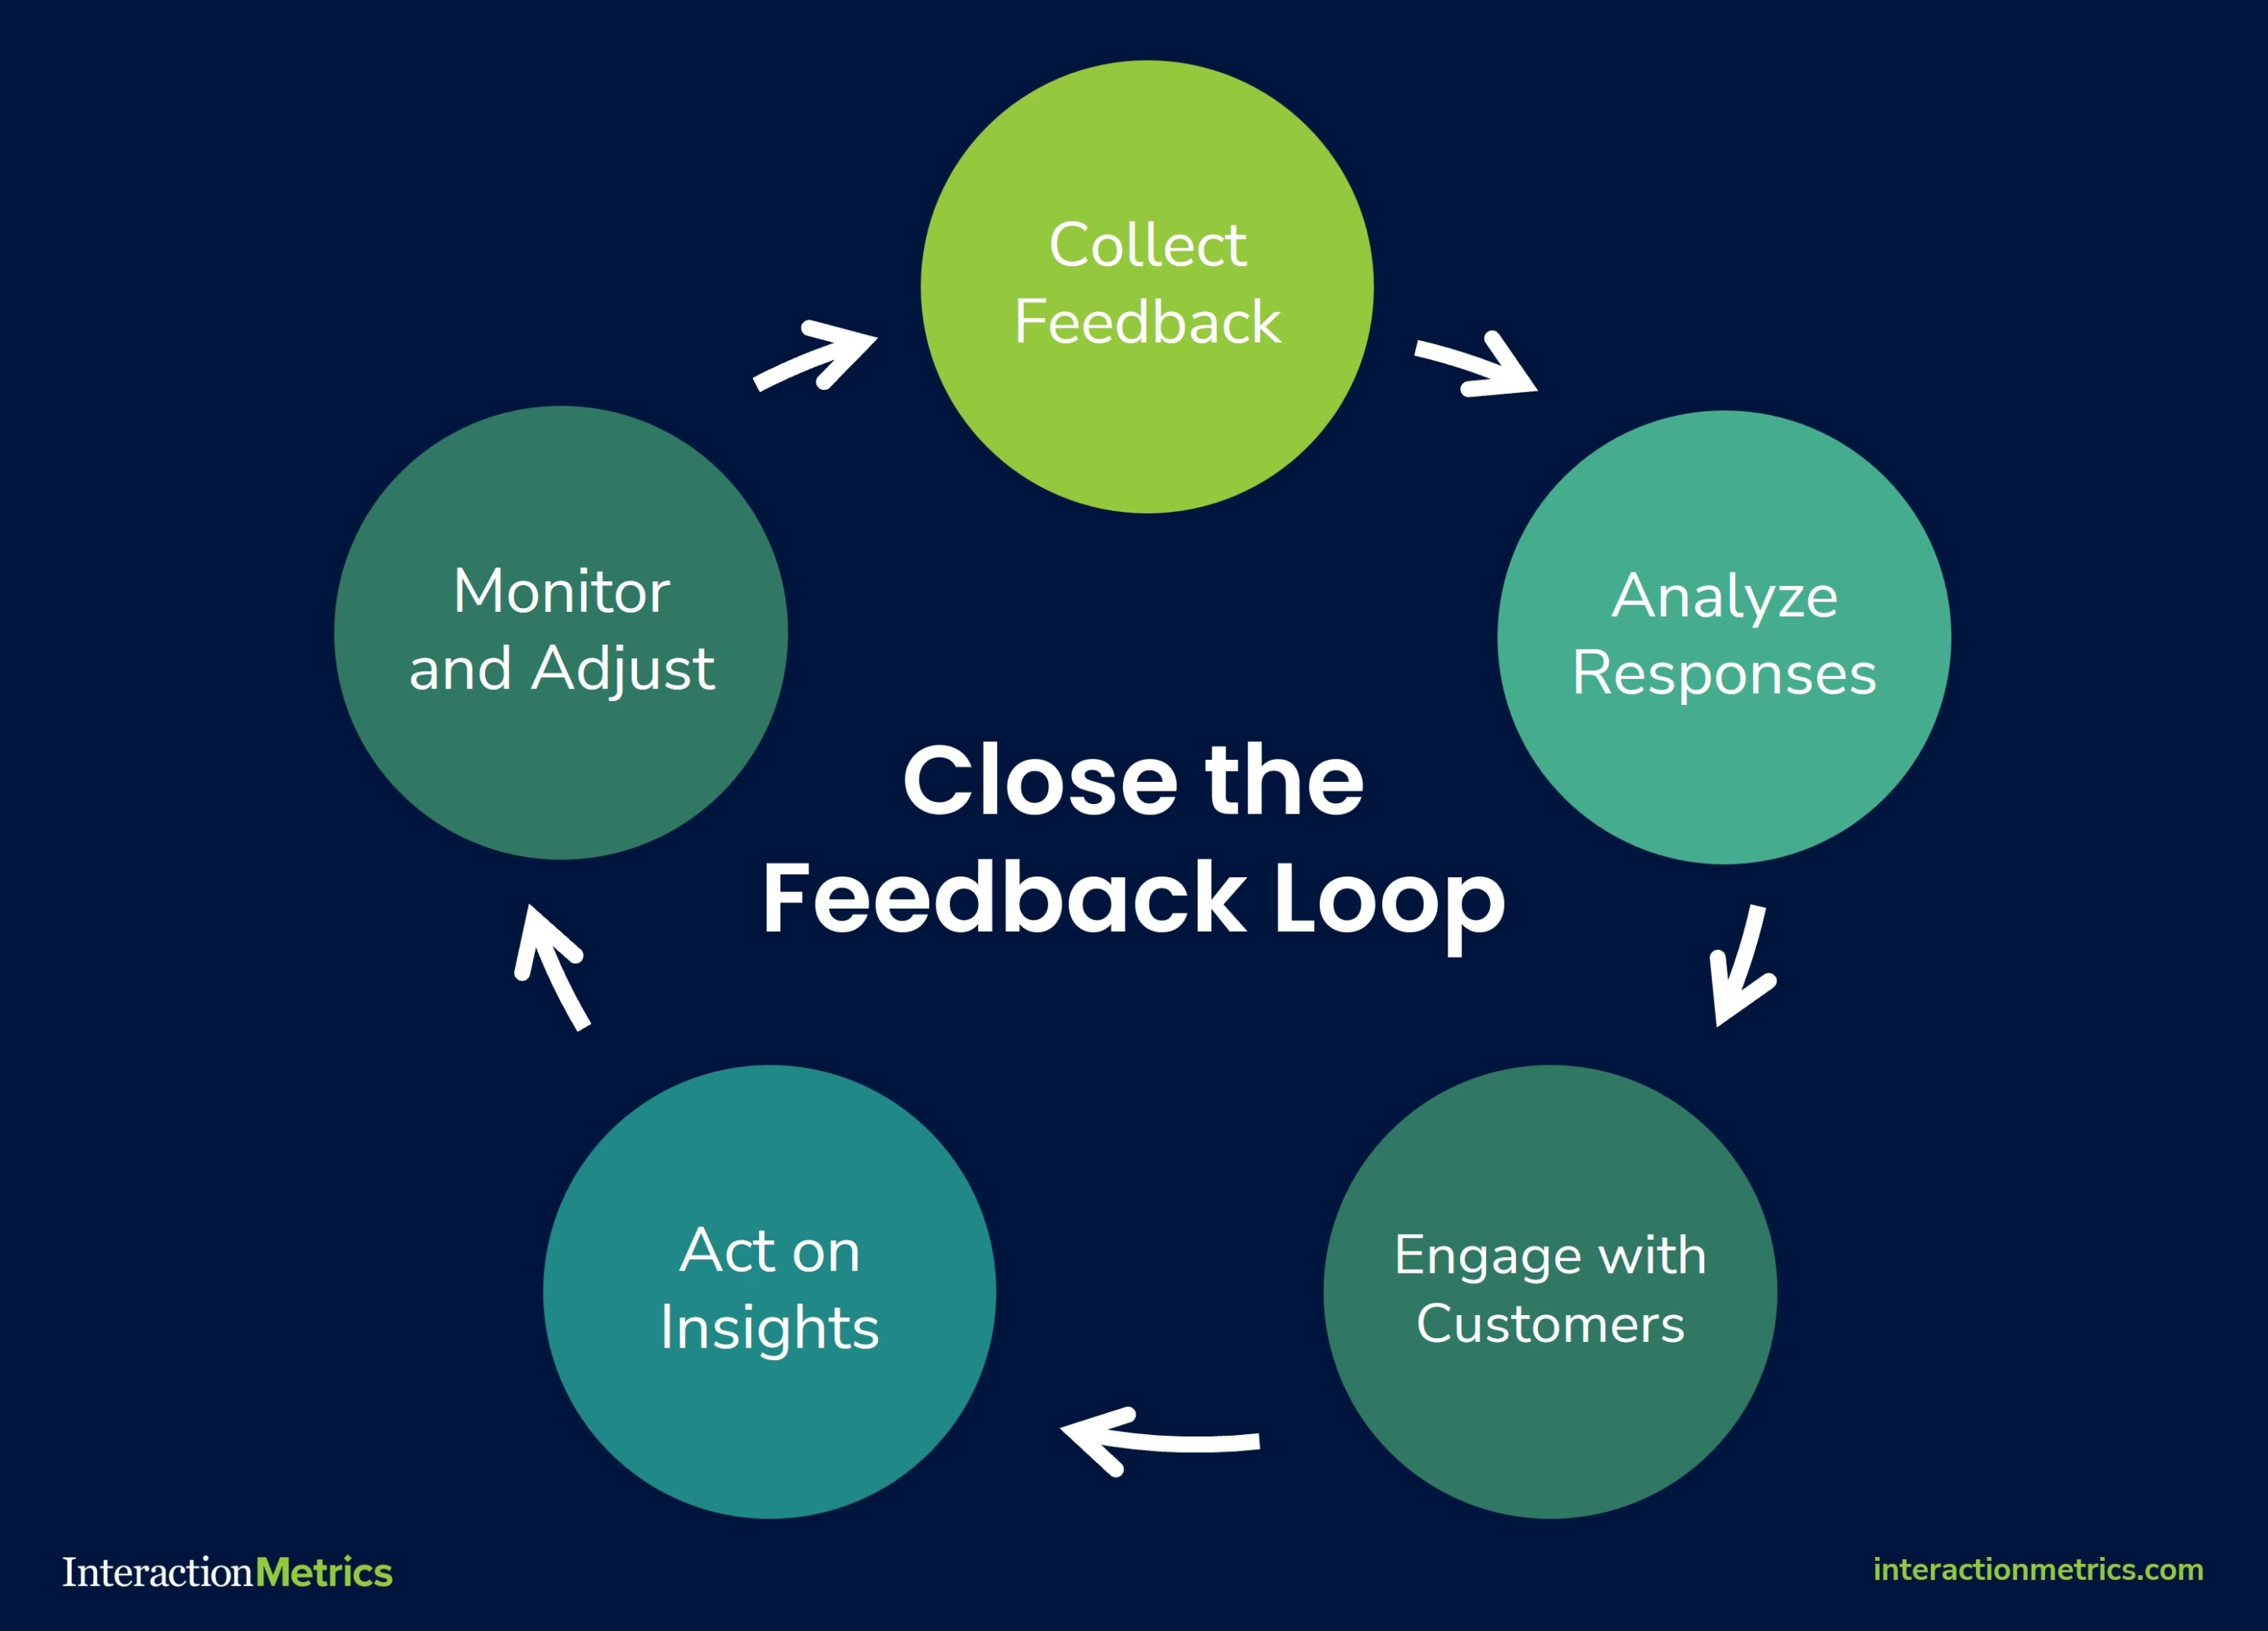
Close the Feedback Loop
Closing the feedback loop means making sure that customer concerns are actually addressed, improvements are made, and relationships are strengthened.
The reason this is so important is that most customer surveys today are a farce.
They are sent from “do not reply” email addresses, which means customer data they collect vanishes into a black hole.
Companies ask for feedback, but when they don’t close the feedback loop, they fail to acknowledge or act on it.
Simply gathering NPS data without following up can leave valuable insights untapped and customers feeling unheard.
Remember, surveys are conversations, not transactions. If you’re asking for feedback, be prepared to listen and respond.
One of the most effective ways to close the loop is by reaching out to detractors—customers who rated their experience between 0 and 6.
These customers are at risk of churning, but engaging them directly can turn a negative experience into an opportunity for retention.
Businesses should follow up with detractors promptly, acknowledge their concerns, and take actionable steps to resolve issues. This helps improve NPS over time while also building stronger relationships with your customers.
Businesses should also engage with promoters who rated their experience a 9 or 10 should also be engaged. Encouraging these people to leave reviews, share testimonials, or refer others can amplify positive word-of-mouth marketing.
In addition to individual follow-ups, businesses should analyze trends across all customer feedback and implement broader improvements. If detractors repeatedly mention a specific complaint, it signals a systemic issue that needs to be addressed.
Consistently closing the feedback loop fosters stronger customer relationships and demonstrates a commitment to continuous improvement.
How to Improve a Low Net Promoter Score
A low Net Promoter Score signals customer dissatisfaction and a risk of churn, but it also provides an opportunity for businesses to identify weaknesses and take targeted action to improve the customer experience.
The key to improving your net promoter score lies in a combination of qualitative feedback analysis, customer experience enhancements, and strategic resolution.
Identify Customer Pain Points Through Qualitative Feedback
NPS alone doesn’t tell the full story. To understand why customers feel the way they do, businesses need to analyze open-ended survey responses, customer complaints, and support interactions.
Identifying common themes among detractors (0-6) will reveal pain points such as product frustrations, slow service, or poor communication.
Without qualitative feedback, businesses risk making changes that don’t align with what truly matters to customers.
Use NPS Feedback to Enhance Customer Experience
Once businesses identify areas of concern, the next step is to implement customer experience improvements.
This may include streamlining support processes, improving product usability, or addressing specific complaints raised by detractors.
Companies should also focus on passives (7-8)—these customers are on the fence and could become promoters with minor enhancements to their experience.
Proactively engaging with passives and resolving their concerns can help lift overall NPS over time.
Strategies for Addressing Common Customer Dissatisfaction Issues
Companies with low NPS face common challenges like inconsistent service, unmet expectations, lack of communication, and insufficient proactivity. Addressing these issues requires:
- Improving response times: Slow customer service is a common complaint among detractors. Faster response times and proactive support can boost customer satisfaction.
- Setting clear expectations: Customers may rate a company poorly if there’s a disconnect between what was promised and what was delivered. Aligning marketing messaging with actual product capabilities helps prevent dissatisfaction.
- Training employees on customer engagement: Frontline employees play a massive role in customer satisfaction. Making sure they have the knowledge and tools they need to resolve issues efficiently can make an immediate difference in NPS.
That said, you may need to do more than implement the tips above to raise NPS. To figure out what else must be done, approach your customers from a perspective of curiosity. Use follow-up questions to determine what needs to change.
Run Your Next Net Promoter Survey With Interaction Metrics
A well-designed NPS survey should go beyond a single question and provide actionable insights that drive meaningful improvements. Interaction Metrics takes NPS to the next level by ensuring surveys are scientifically designed, free of bias, and tailored to uncover the real reasons behind customer sentiment.
While the rest of the industry encourages an indiscriminate flood of surveys, we hold the belief that surveys should be rare, intentional, and executed with precision.
Unlike traditional NPS surveys that rely on a one-size-fits-all approach, Interaction Metrics provides custom-built surveys designed to fit your unique business needs.
We analyze open-ended responses, integrate multiple data sources, and apply science-based methodologies to make sure your results are both accurate and actionable.
With transparent pricing, expert survey design, and deep analytical insights, Interaction Metrics helps companies move beyond a simple score and uncover the insights they need to create loyal customers, improve experiences, and drive business growth.
If you’re ready to gain real, data-driven customer feedback, contact Interaction Metrics today to get started on your next NPS survey.
Frequently Asked Questions About NPS
What should I ask when running an NPS survey?
When running an NPS survey, start with the standard NPS question: “How likely are you to recommend us to a friend or colleague?” on a 0-10 scale.
To gain deeper insights, follow up with open-ended questions such as “What is the primary reason for your score?” or “What could we do to improve your experience?”
These questions help businesses understand the why behind the score and uncover areas for improvement. Keeping the survey simple and focused will lead to higher response rates and more actionable feedback.
When should I run an NPS survey?
The best time to run an NPS survey depends on your goals and the type of feedback you want to collect.
Many businesses conduct NPS surveys periodically (quarterly or annually) to track customer sentiment over time.
Others run them after key interactions, such as a purchase, onboarding process, or customer service experience, to measure satisfaction at critical touchpoints – but this is a mistake! After all, customers don’t recommend you based on one event. Instead, your customers will recommend you (or not) because of their overall experience from start to finish and over time.
It’s important to avoid survey fatigue—sending surveys too frequently can lead to lower response rates and unreliable data. By choosing the right timing, businesses can capture meaningful insights that reflect customer loyalty and areas for improvement.
What is employee NPS (eNPS) and how is it different?
Employee Net Promoter Score (eNPS) measures employee loyalty and engagement. Traditional NPS evaluates customer satisfaction.
Instead of asking customers how likely they are to recommend a company, eNPS surveys might ask your customer service agents or other employees: “How likely are you to recommend this company as a place to work?”
Employees respond on the same 0-10 scale, with promoters (9-10), passives (7-8), and detractors (0-6).
While NPS helps businesses understand how customers perceive their brand, eNPS provides insights into workplace culture, employee satisfaction, and areas for organizational improvement.
A strong eNPS often correlates with better customer service, as engaged employees are more likely to deliver positive customer experiences.
How can businesses benchmark their NPS against competitors?
Businesses can benchmark their Net Promoter Score against competitors by comparing their scores to industry averages and sector-specific benchmarks.
Many research firms publish annual NPS reports that provide insights into typical scores across various industries, helping businesses gauge their performance relative to peers.
Companies can also collect competitive intelligence by analyzing public reviews, social media sentiment, and third-party survey data to understand how their customer experience compares.
Is segmenting NPS important?
Segmenting scores by demographics, customer categories, or product groupings is necessary to glean actionable customer insights.
Without these segmentations, you will probably be at a loss for what actions to prioritize and which next steps to take.
What metrics should you track alongside NPS?
To get a complete picture of sentiment throughout the entire customer journey, businesses should track additional metrics alongside NPS, including:
- Customer Satisfaction Score (CSAT): Measures immediate satisfaction with specific interactions, such as a support call or product purchase.
- Customer Effort Score (CES): Evaluates how easy it is for customers to complete key tasks, such as resolving issues or navigating a website.
- Churn Rate: Tracks the percentage of customers who stop using a product or service over a given period, helping businesses identify retention challenges.
- Customer Lifetime Value (CLV): Determines the total revenue a business can expect from a customer throughout their relationship.
============================================
Care to discuss your next Net Promoter Survey? Get in touch!
============================================
The post What Is Net Promoter Score (NPS) & Why Does It Matter? appeared first on Interaction Metrics.
]]>Read more
The post Interactive Data is the Future, Here’s Why appeared first on Interaction Metrics.
]]>Interactive Data Motivates Teams
Measuring the customer experience is crucial, but visualizing that measurement with interactive data is equally important. Here’s why: dynamic data motivates teams to take action and facilitates collaboration across departments. Without productive next steps there is no customer experience improvement, much less customer experience transformation. So, whether you use customer surveys, mystery shopping, or customer service evaluations to measure the customer experience, interactive data are what you need. Flat charts and static reporting leave you stuck in the 1990’s.
What’s the Fuss About?
As content software company ion interactive noted:
“…the increasing economic might of younger, digital-savvy consumers…will soon make interactive content an imperative…increasing exposure to interactive content will excite an appetite…that cannot be satisfied with traditional passive content alone.”
We couldn’t agree more. Everyone wants fully-immersive content, whether it’s in art, TV, or the latest app. Customer experience programs are no different. In order for businesses to keep up with the shifting landscape of expectations, they need to integrate interactive data, and fast.
Interactive data and dashboards are the future of effective customer experience communication. The difference between genuine business intelligence (BI) and static reports is that BI puts you in the power seat. Interactive dashboards empower clients and executives to be in control of their own data. They grab attention and let them participate in the process of data analysis.
Again from ion interactive, Scott Brinker their Co-Founder and CTO explained, “…interactive content engages participants in an activity: answering questions, making choices, exploring scenarios…Individuals have to think and respond; they can’t just snooze through it”.
We couldn’t have said it any better. Interactive content by its very nature demands engagement.
Using Interactive Dashboards
One particular advantage of interactive customer experience dashboards is that you can filter your data down to fine details without losing sight of the big picture. You can visualize and share what’s going on in your customer surveys, customer service evaluations, or verbatim analyses.
Even with the most colorful static reporting, you won’t get the same insight, clarity, and depth that’s possible with interactive data. With an interactive format that enables filtering you can:
- See real-time metrics at a glance
- Compare performance scores over periods of time
- Keep tabs on problematic areas
- Focus on key elements (such as product or associate) to gain insight
Dashboard Example
This is a picture of a very simple dashboard for a customer service environment. The yellow highlighted portion is what makes this dashboard dynamic and allows drill downs by:
- Spanish vs. English Interactions
- Four Different Teams
- Specific Associates
- Audit Period
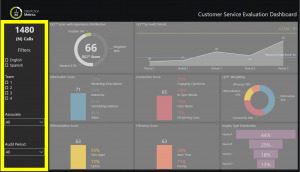
This dashboard is best suited for managers because it gets at associate details.
A dashboard that shows progress over time is a better option when you want to share customer service evaluation data with teams at large.
Now, here’s that actual dashboard. Filter by team, language, associate, or audit period and see how the data changes.
While interaction moves you forward, you’ll still need to complement your dashboards with Findings Reviews to identify checklists, goals, and who’s in charge of specific next step actions.
Bottom line: there’s a shifting demand toward interactive content. This is true among all generations and across industries. It’s no different with your business! Integrating interactive dashboards into your customer experience program will keep you relevant by enabling you to visualize–and prioritize–your specific customer experience opportunities.
Toward more interaction!
The post Interactive Data is the Future, Here’s Why appeared first on Interaction Metrics.
]]>