Read more
The post B2B Customer Experience Research—Latest CXPA Roundtable appeared first on Interaction Metrics.
]]>Customer experience research is evolving rapidly—especially for B2B companies, where their high-value relationships demand precision insights.
That’s why earlier this month, for our B2B CXPA Roundtable, I hosted Matt Egol, Jack-Morgan Mizell, and Gillian Salerno-Rebic to explore the possibilities and limitations of using AI for research.
I posed questions to the group to get their take on whether AI enhances human research or replaces humans altogether? And can AI decode customer behavior in complex B2B environments?
About the B2B CXPA Roundtables
I host the B2B CX Roundtables every six weeks. They’re open to all B2B professionals, although members of the CXPA (Customer Experience Professionals Association) get priority for all sessions in which the audience size is capped. Our Roundtables are 55 minutes and highly interactive. If you’d like to be included in our Notifications List, add your name here.
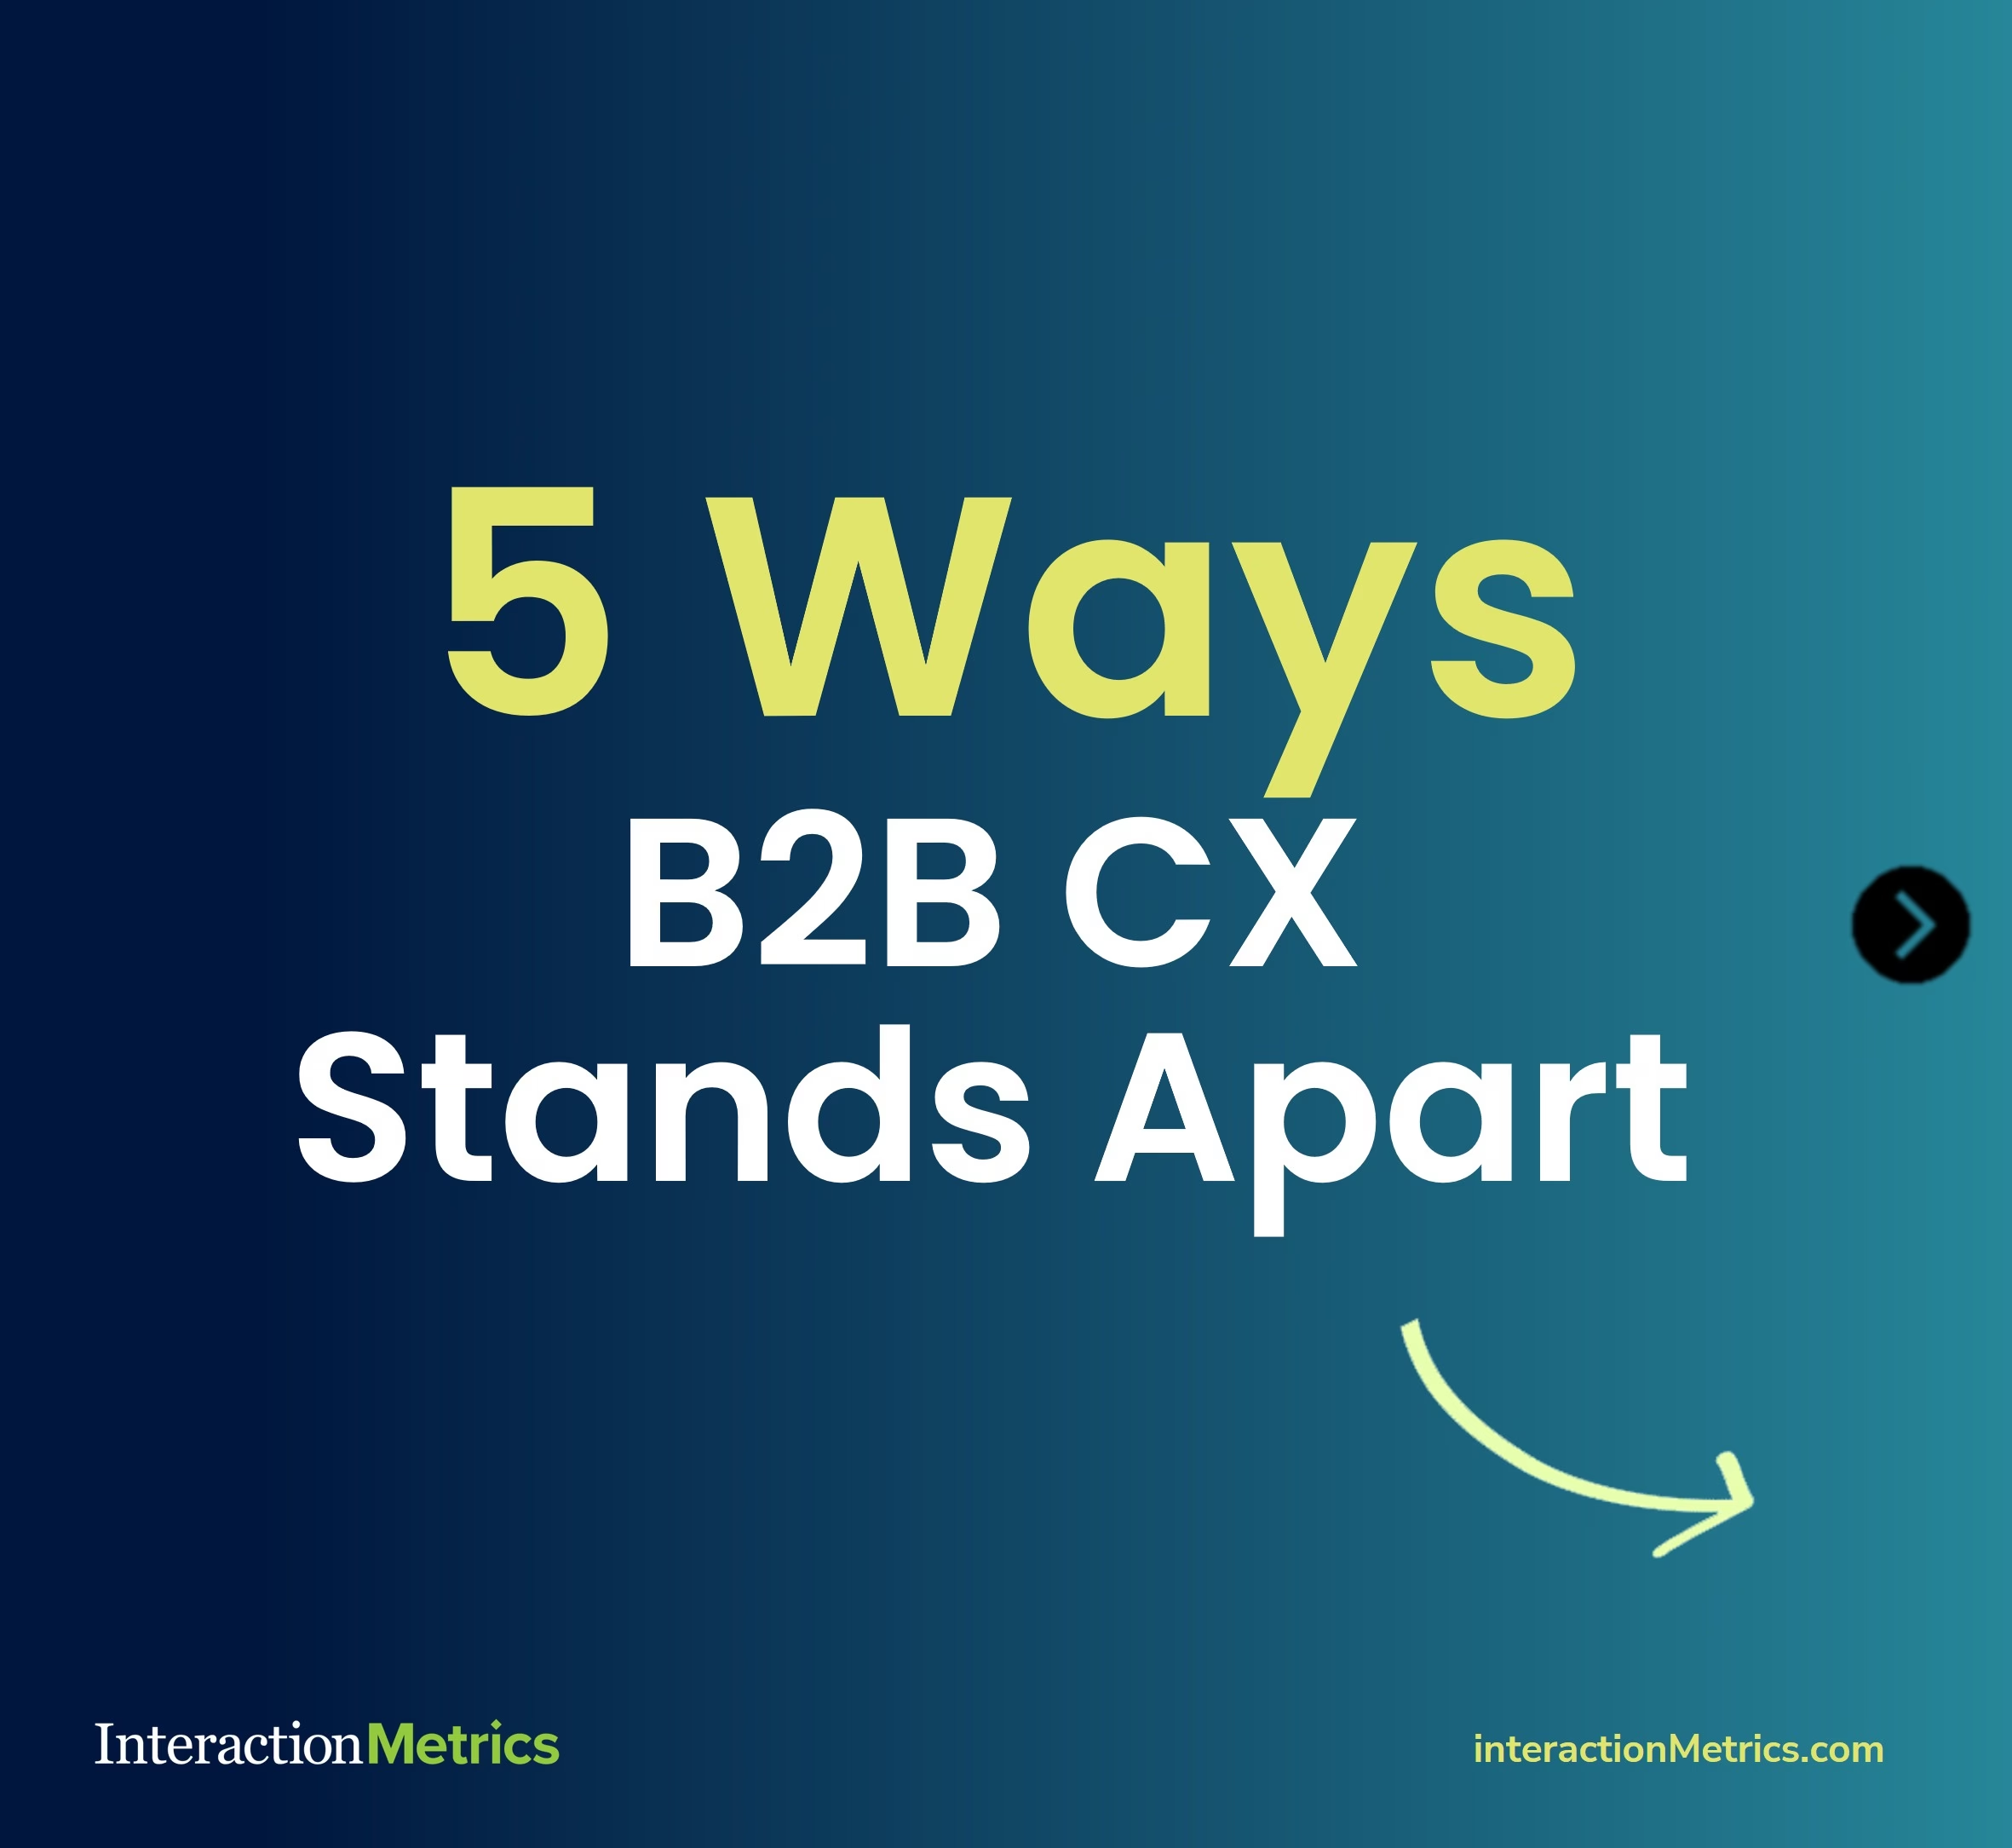
The B2B Customer Experience
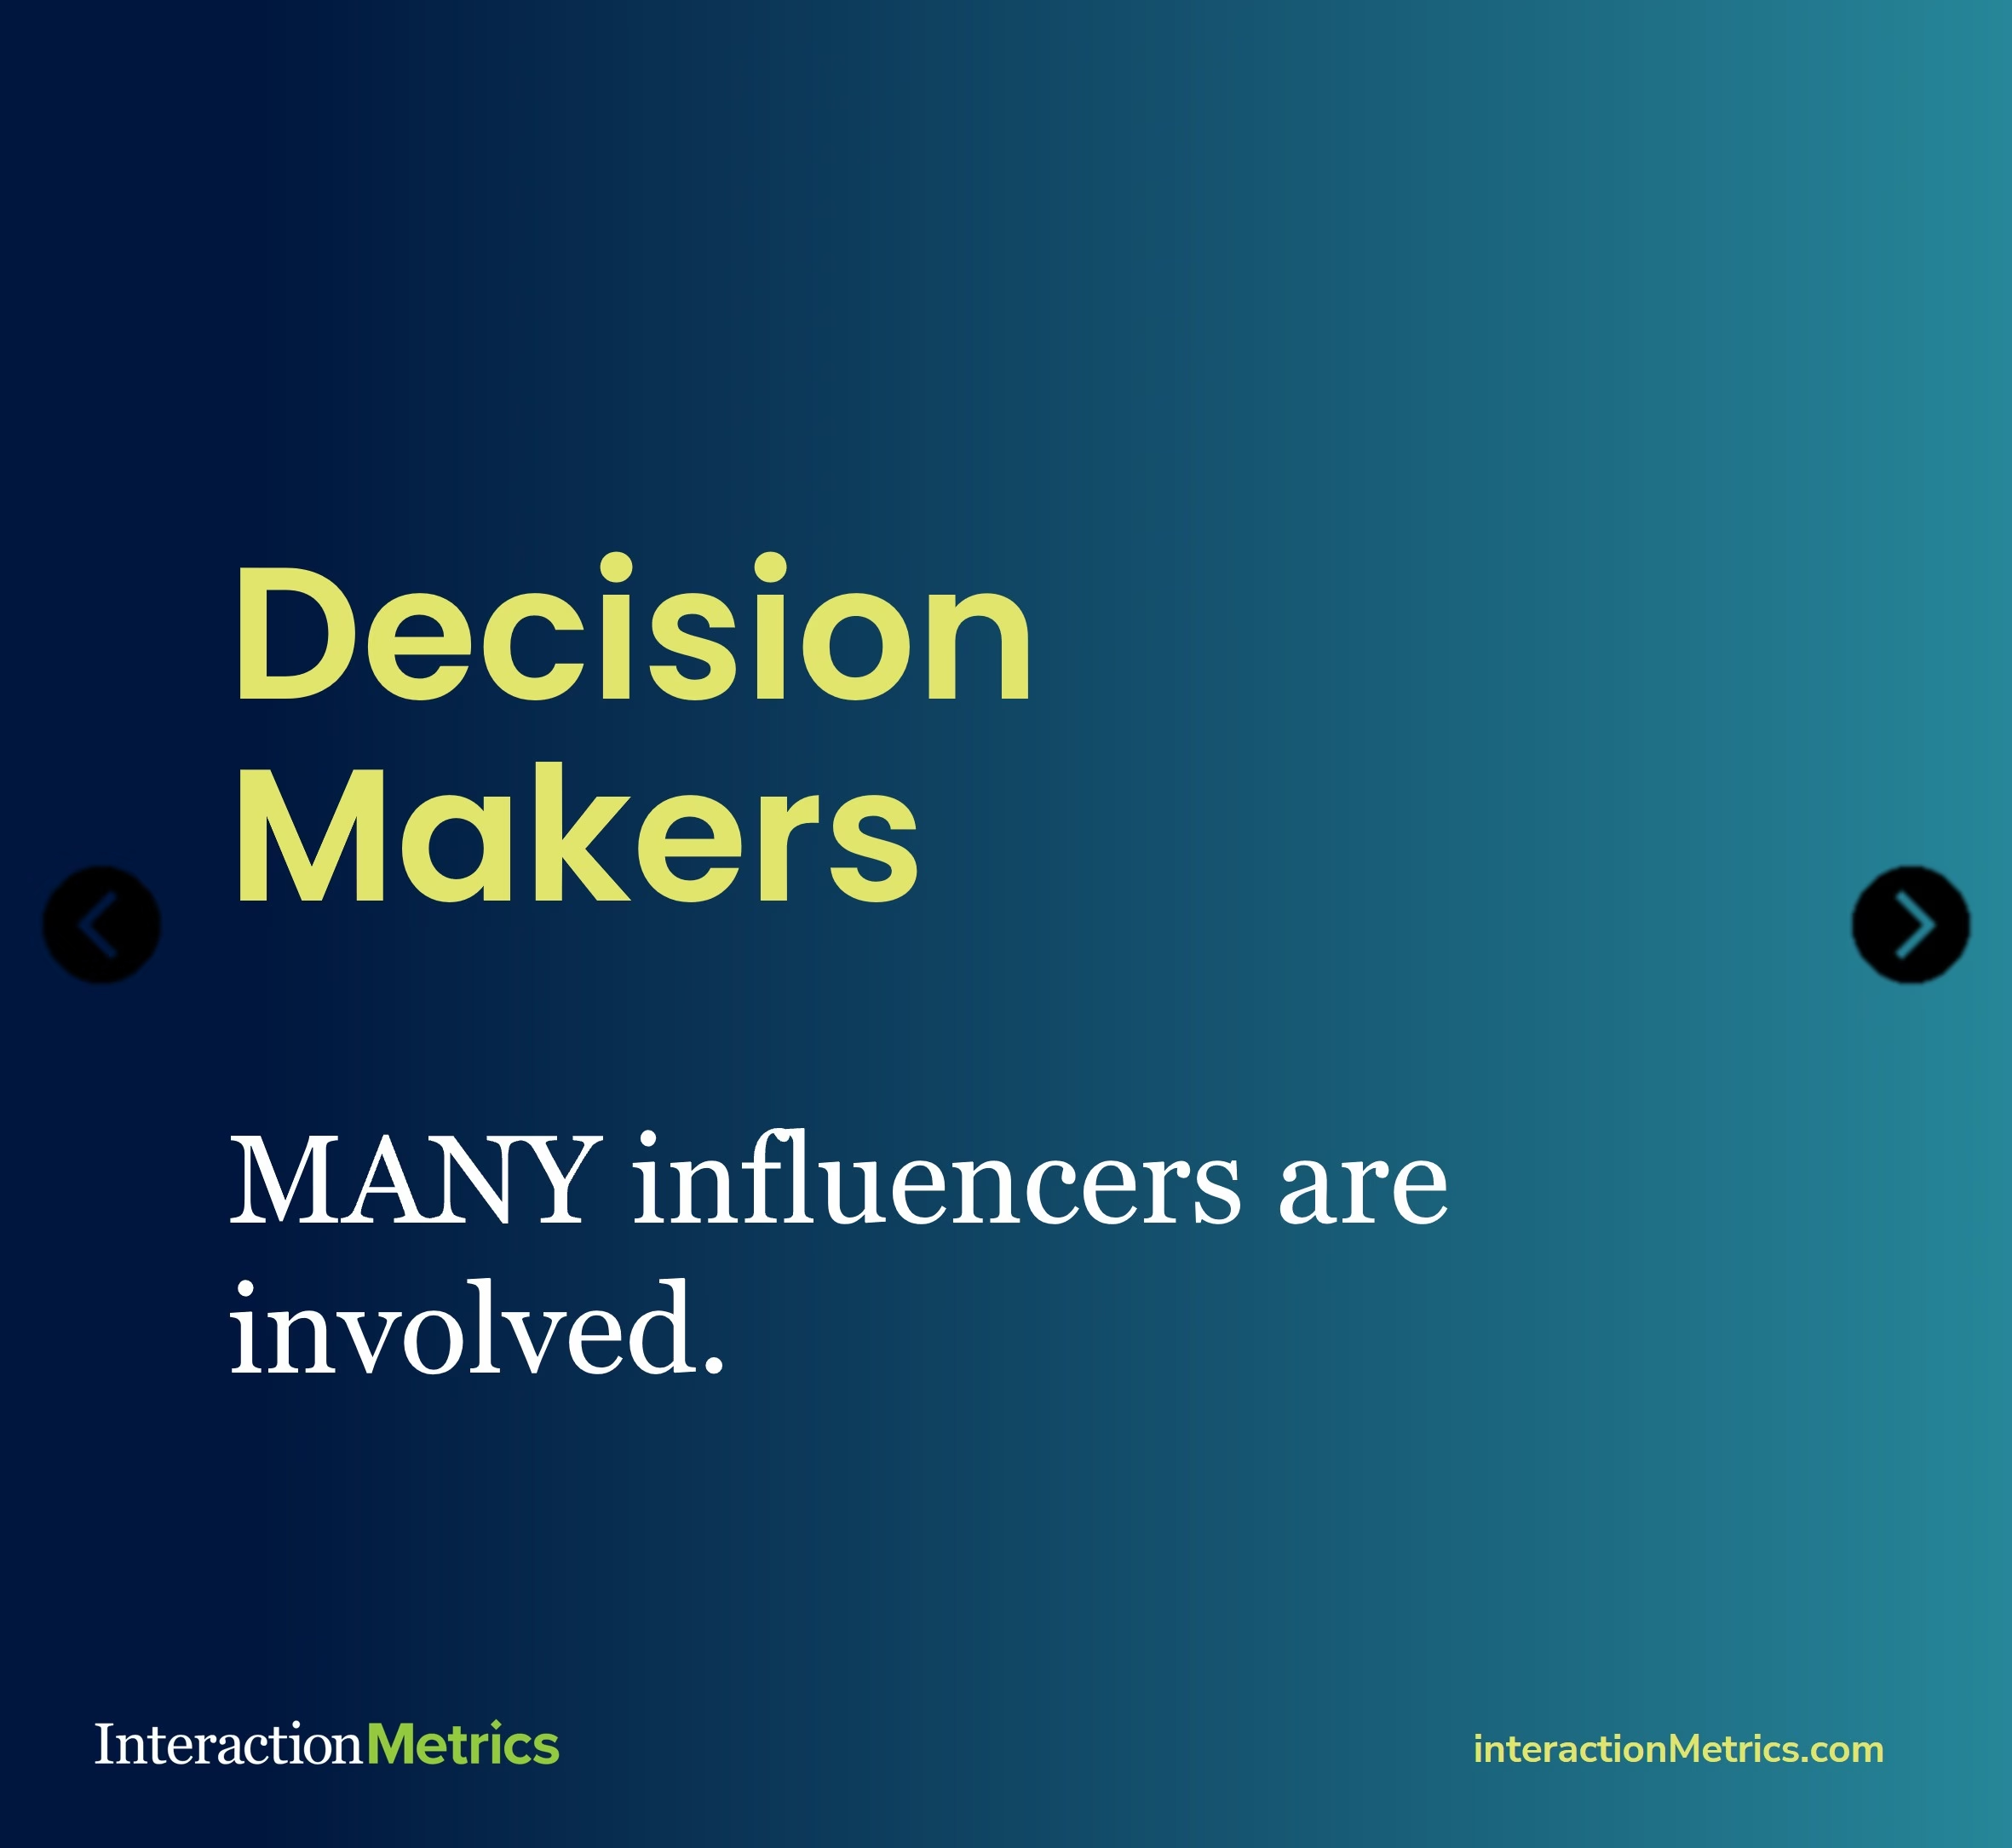
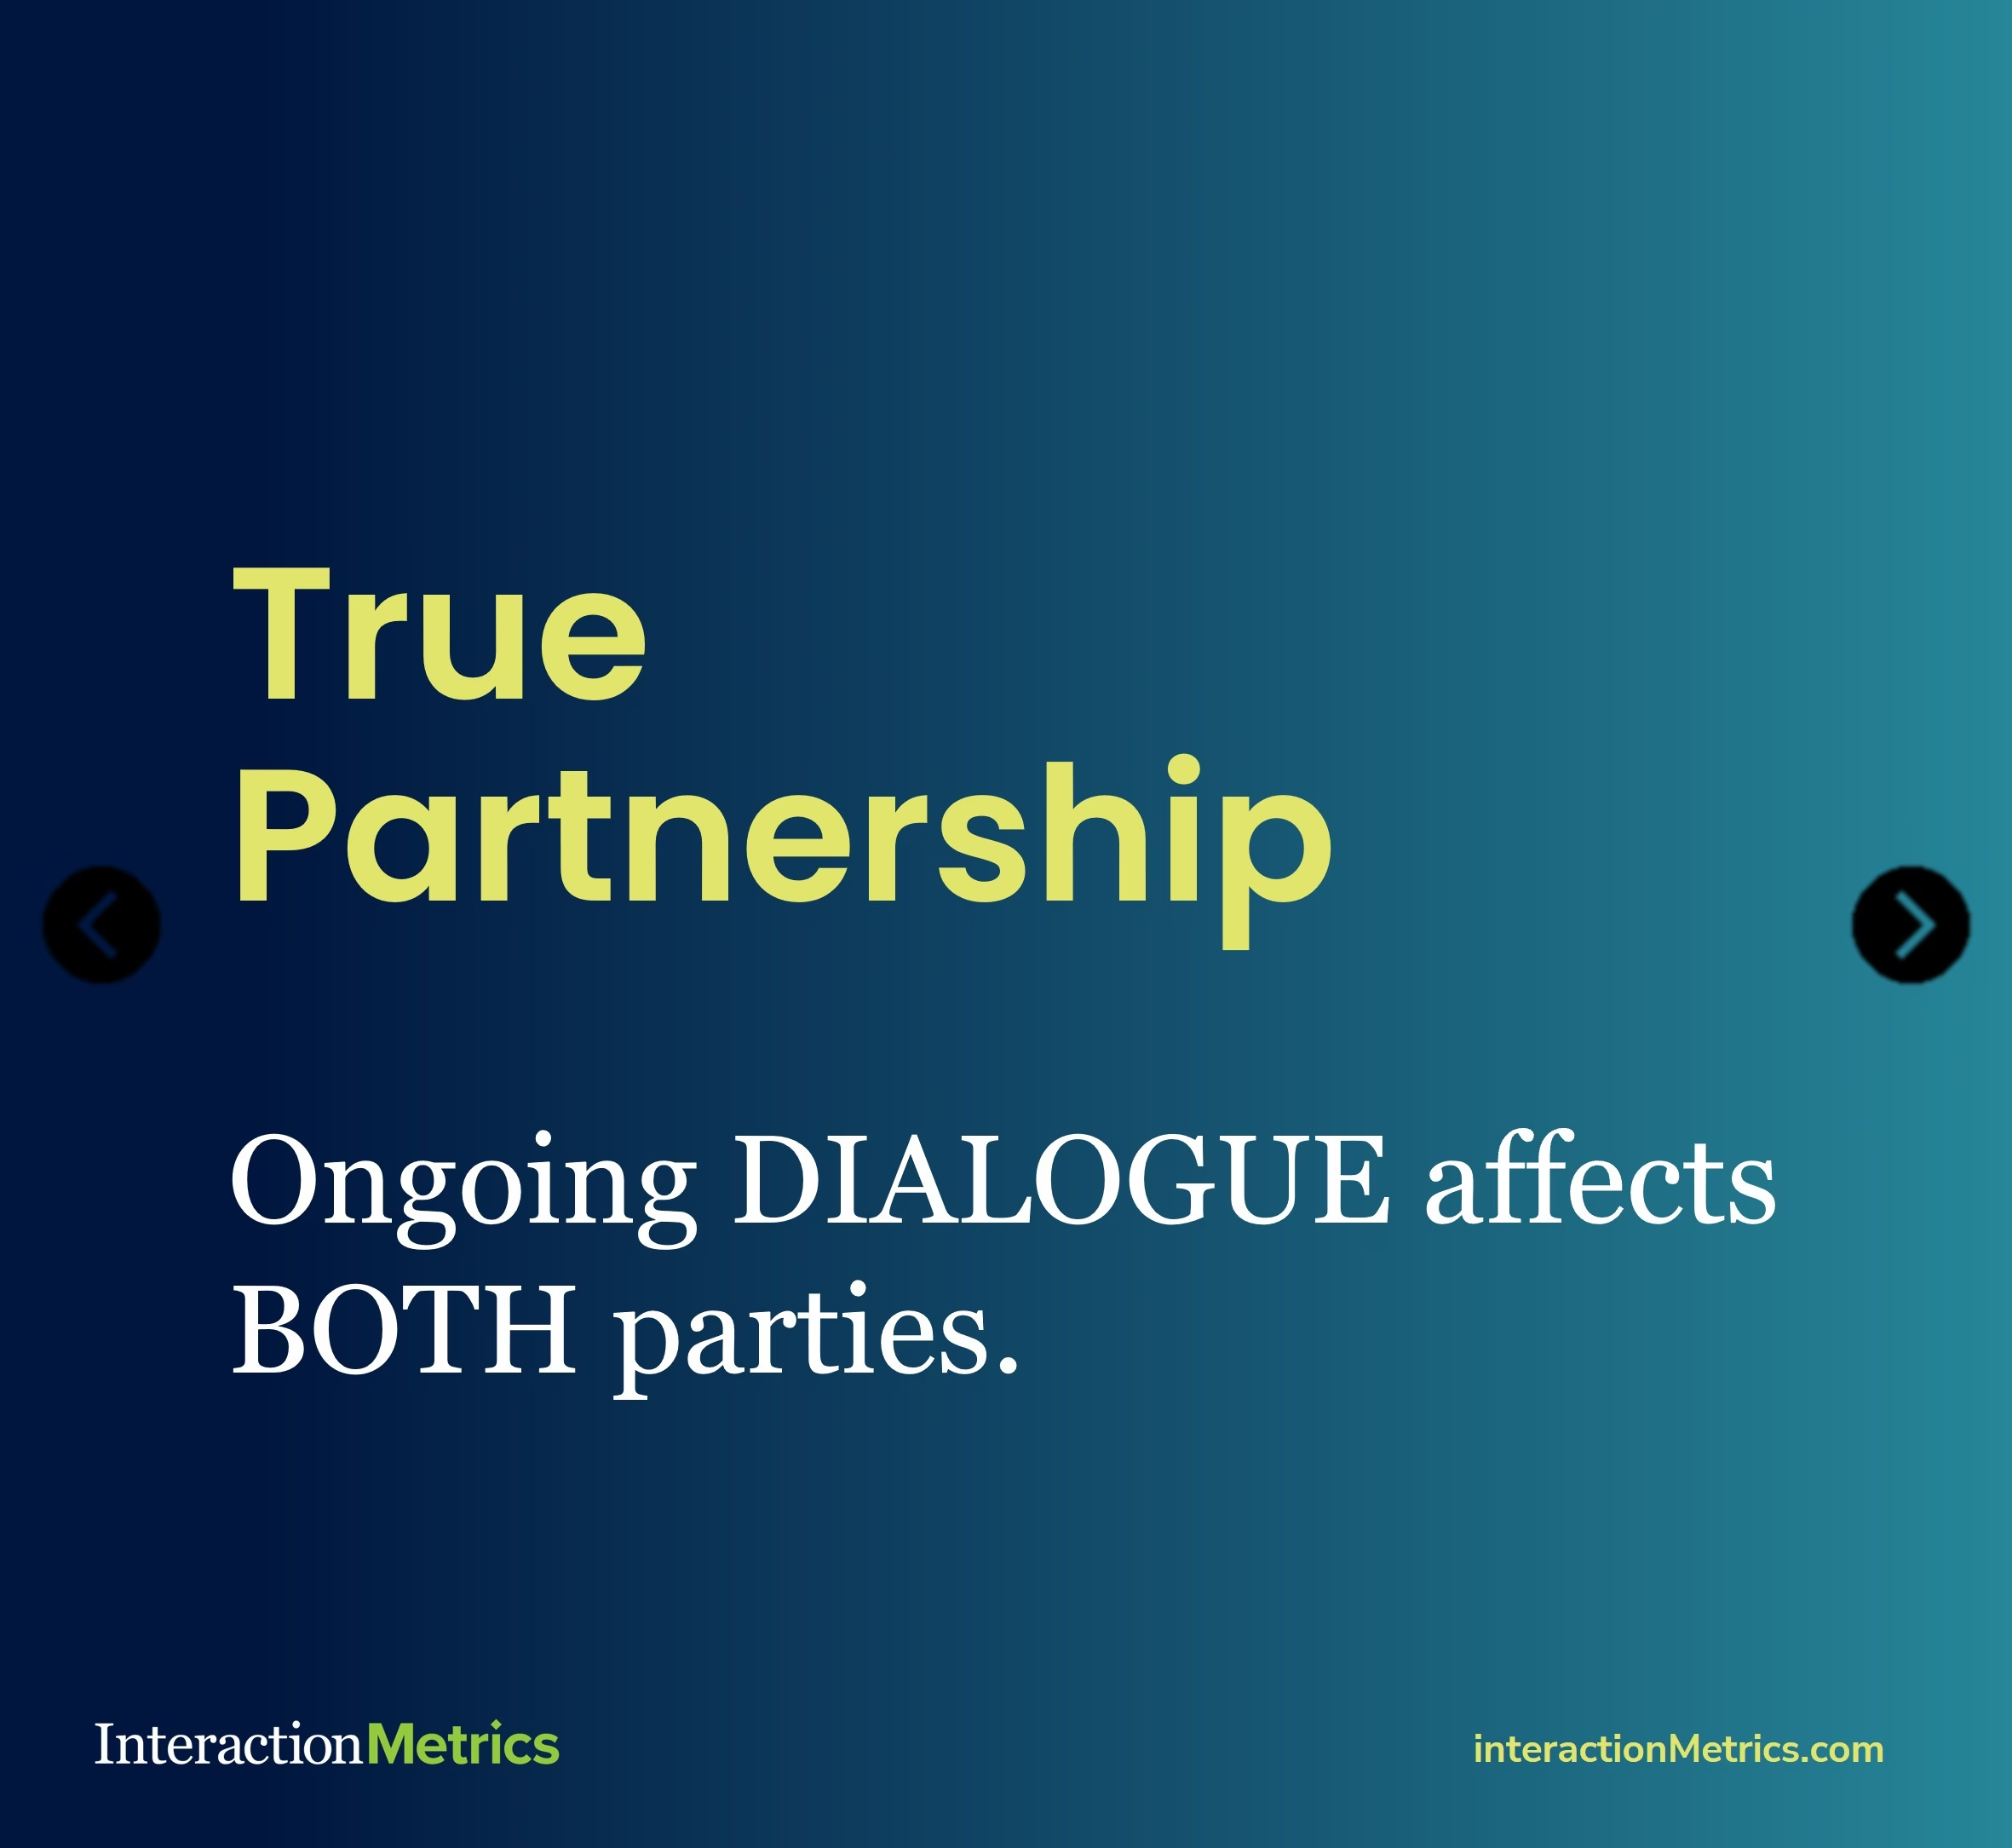
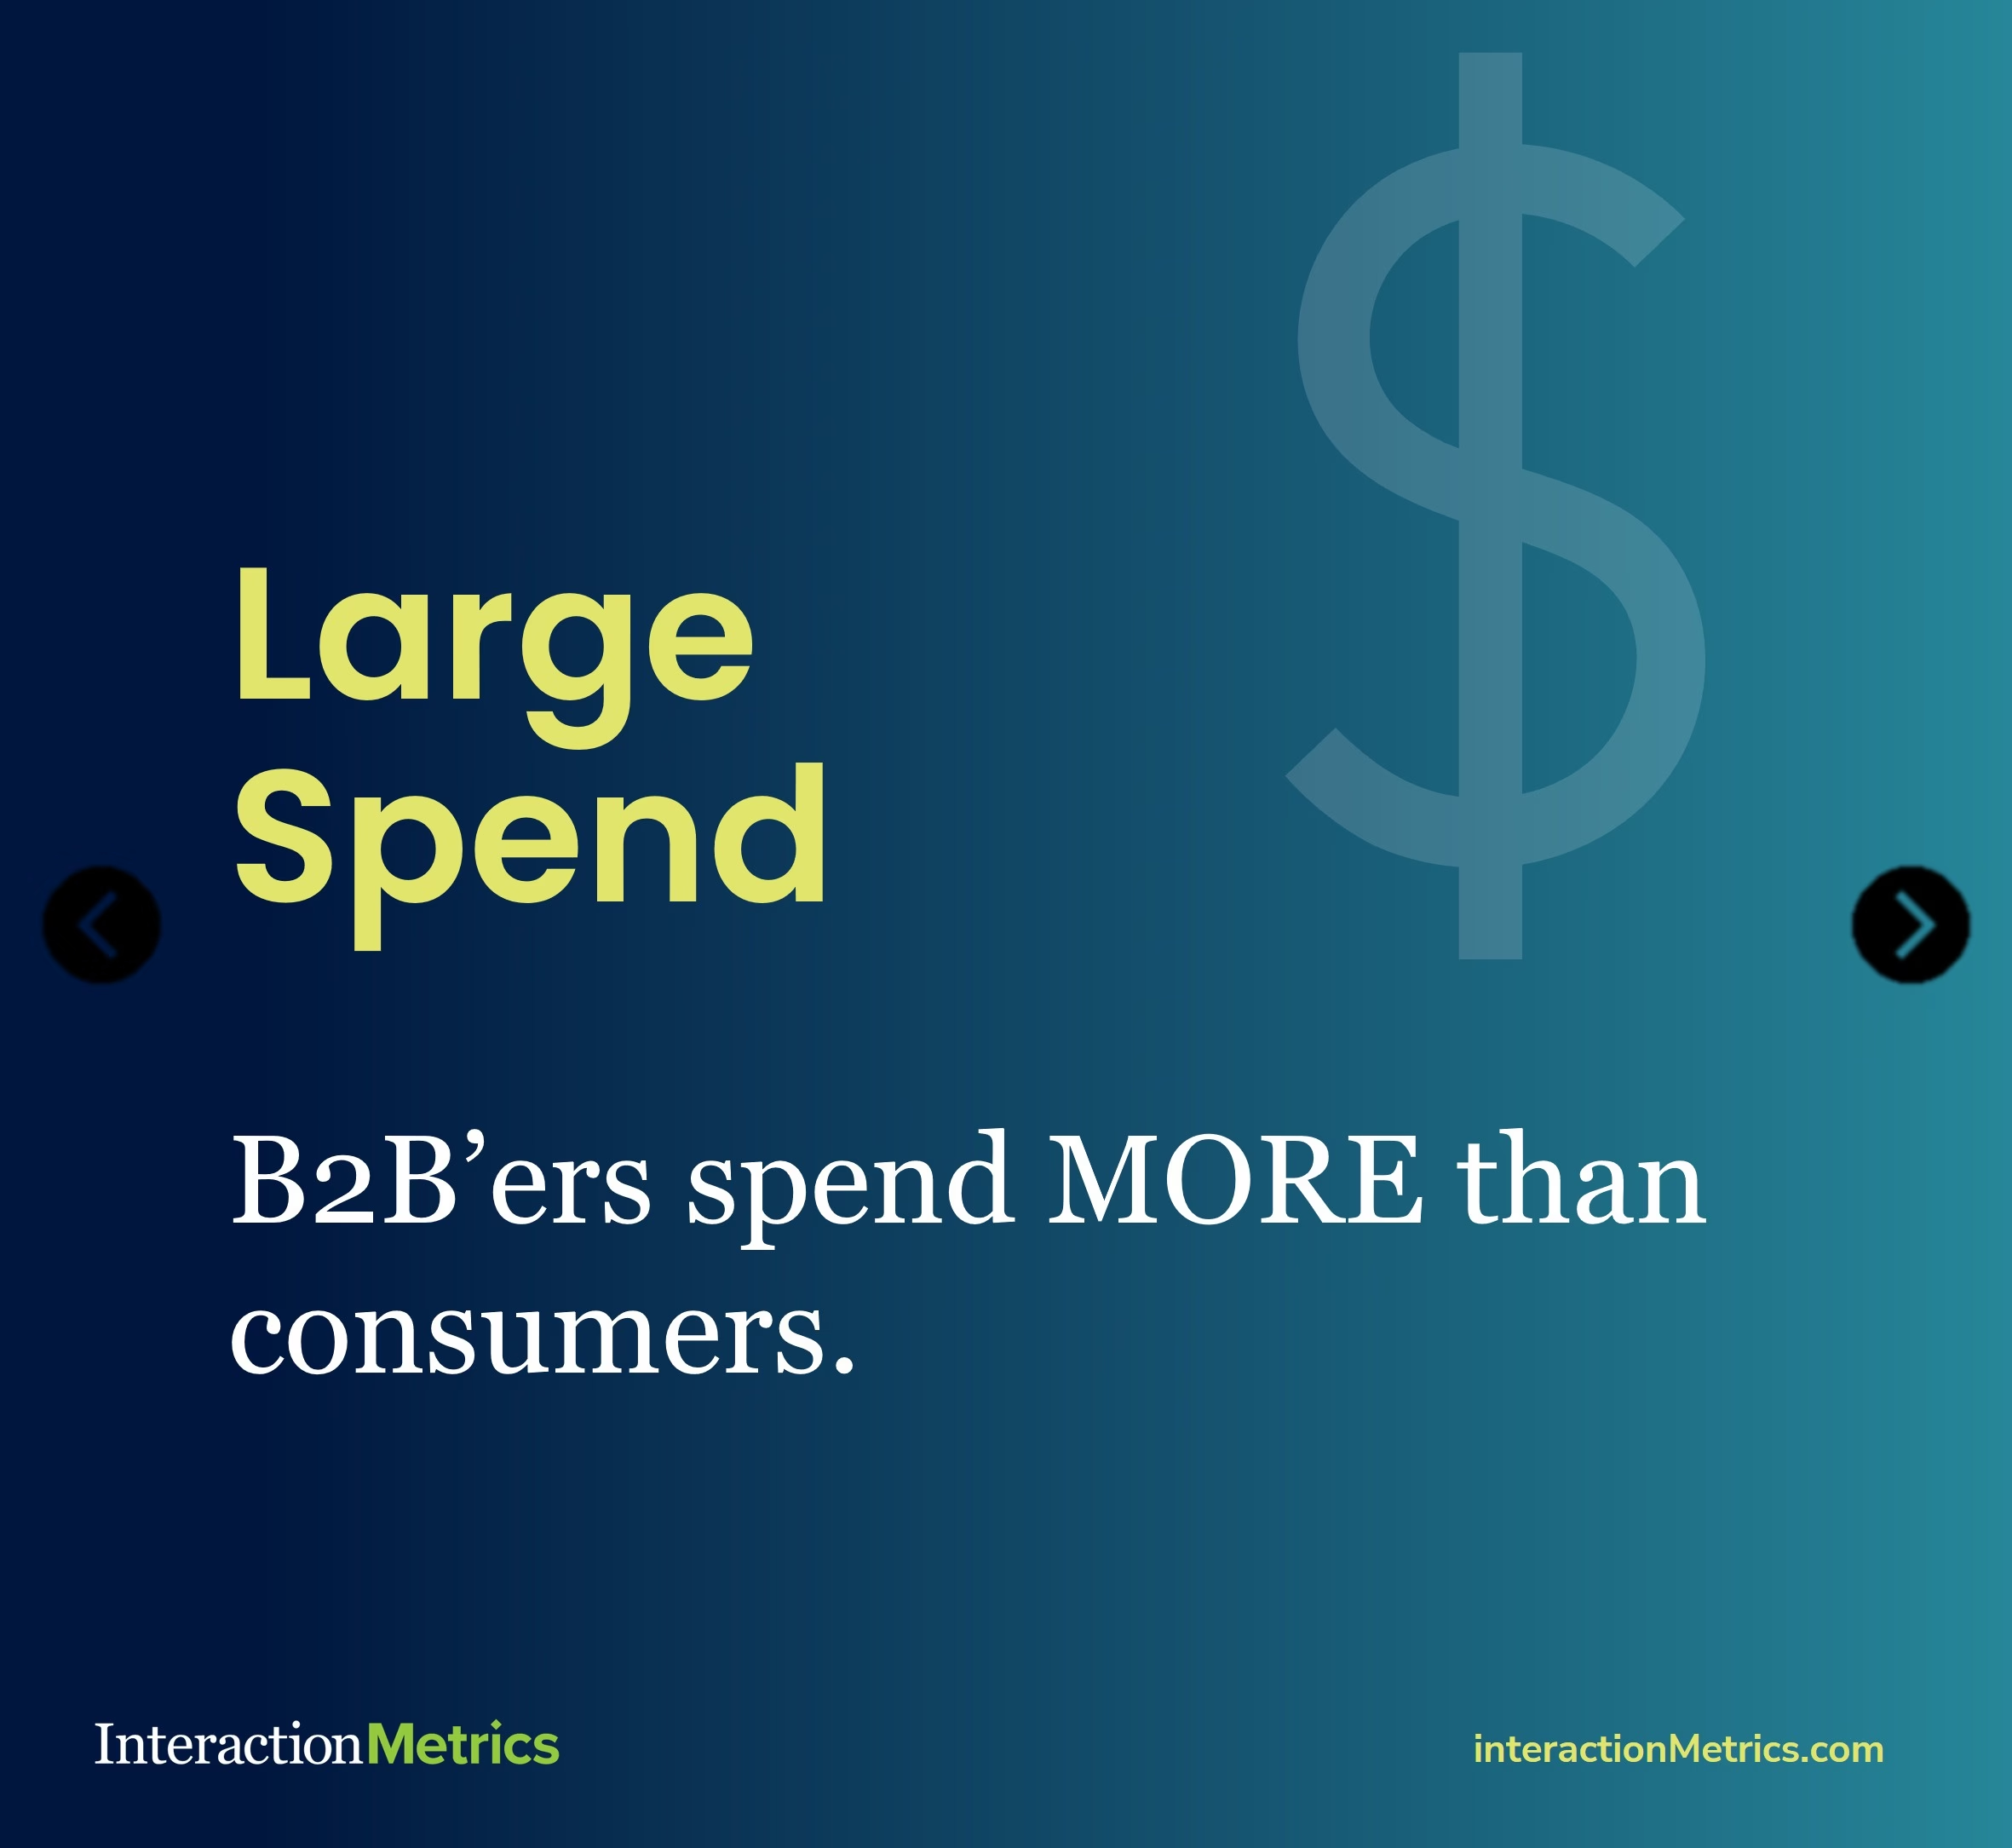
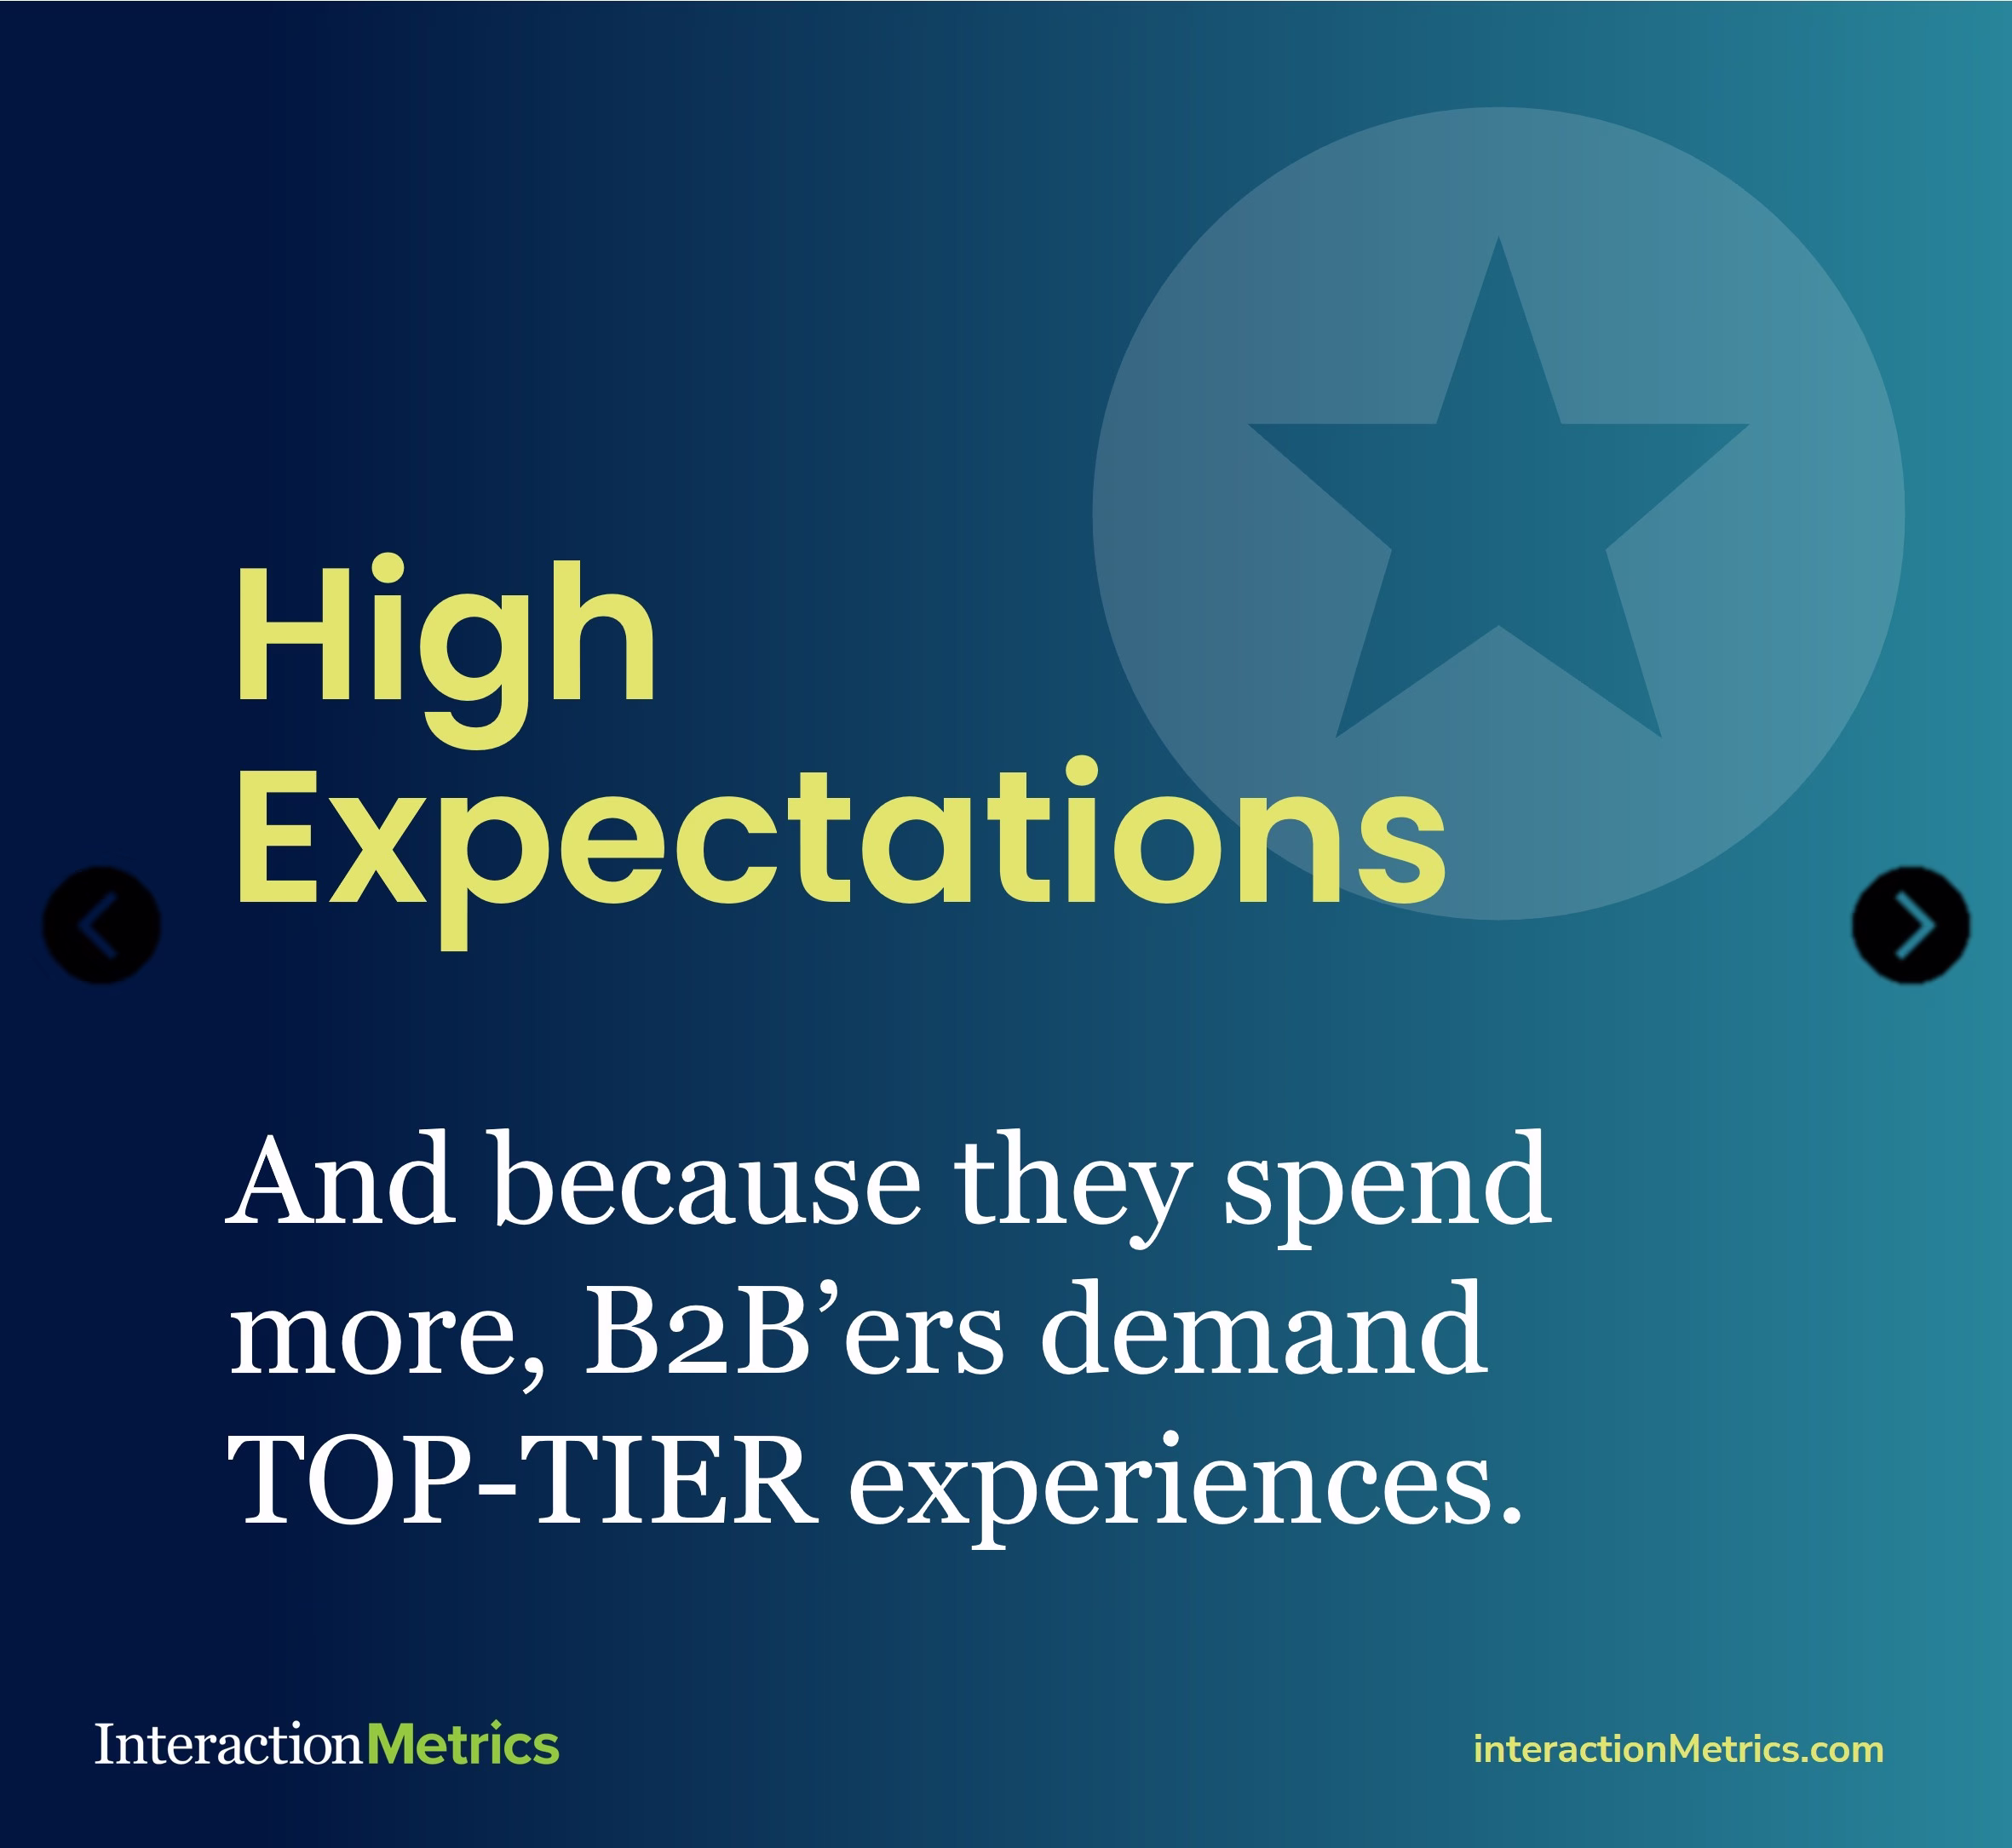
To get everyone on the same page, I usually start each Roundtable by clarifying how B2B customer experiences stand apart from consumer experiences. Based on interviews I’ve done with leaders at Intel and other companies, it’s become clear that some of the differences include: a partnering relationship, a larger customer spend, and multiple decision-makers involved.
My Perspective on AI for B2B Research
AI is great at surfacing patterns across a full dataset of customer comments—it can generate summaries, spot recurring themes, and even suggest fresh angles for analysis.
Tools like ChatGPT and Gemini are especially useful for brainstorming formulas, speeding up counts, and forming hypotheses. But when it comes to producing the final output, they fall short. AI often misreads sentiment, loses consistency in formatting, and fails to distinguish urgency or impact. A customer who repeats themselves five times about delivery can skew the data, leading to inflated themes that don’t reflect the full picture.
That’s why our Text Analysis blends the speed of AI with the nuance of human insight.
We use AI to explore ideas and form hypotheses—but humans decide what actually matters. Our researchers weigh emotional tone, assess business risk, and determine which departments are truly at stake. Just because a customer says tech support is their biggest issue doesn’t mean that’s what’s driving them away—it could be poor product quality buried elsewhere in their comments. This is where human judgment turns raw feedback into decision-ready insights. Read more about my perspective on AI as a CX research solution here.
The Panelists’ Perspective: Using AI for B2B Research
The Panelists began by exploring a fundamental question: why do B2B companies need customer experience research in the first place?
The panelists agreed that to improve the customer experience, you have to understand it—and that’s especially true in B2B. Essentially, customer experience research lays the foundation for understanding what customers expect, how they behave, and where they encounter friction.
For B2B companies, research helps in areas like these:
- Clarifying Expectations: Understand what customers actually want—not just what internal teams assume. This informs onboarding flows, training materials, and proactive support efforts.
- Improving Digital Journeys: By tracking how users engage with portals, dashboards, and websites, research pinpoints where customers get stuck, hesitate, or abandon tasks.
- Prioritizing Improvements: Not every pain point is equally urgent. Research helps companies focus on what matters most to their highest-value customers.
- Strengthening Relationships: B2B relationships are built on trust and ongoing value. Research helps teams stay aligned with customer goals over time.
In short, CX research gives B2B companies a way to fuel growth by understanding how companies can become more relevant and connected with their customers.
Watch the discussion here.
Or, because many of you listen on the go, you can download the audio here:
AI Is an Accelerator—Not a Replacement
The panelists are all finding that AI in B2B customer experience research is a lever to augment human capabilities, not to replace them.
As Gillian stated, “It is a tool in our tool belt… It’s not the magical fix-all pill that’s going to eliminate that work for you.”
AI is ideal for:
- Transcribing interviews instantly
- Drafting very initial survey questions – not the final questions
- Analyzing large datasets to develop customer personas
- Testing how different simulated personas experience touchpoints
One especially thought-provoking idea came from Gillian’s experience using simulated feedback in CX research. Rather than gathering input exclusively through live interviews or surveys, this method uses AI-generated personas or predictive models to simulate how a certain type of customer might respond to a product, service, or journey stage.
While this doesn’t replace direct customer feedback, it adds a new layer, especially useful in early-stage research or when exploring hypothetical scenarios. Of course, understanding when to use simulated vs. live methods is critical for B2B companies that want to blend efficiency with depth in their customer experience research.
AI Helps Overcome the “Blank Page” Problem
Jack shared two powerful ways AI supports researchers, especially in fast-moving or unfamiliar B2B contexts.
First, he described how AI helps overcome the “blank page” problem by generating initial drafts of survey questions and frameworks for quantitative analysis. “It’s a good speed tool that then requires me to iterate on it,” he explained. Rather than starting from scratch, AI offers a working draft—freeing up time to focus on refinement and relevance.
Second, Jack emphasized how helpful AI can be for researchers entering industries they don’t yet know well. It’s common for CX Researchers to work across sectors—and each industry and company has its own language, sales process, and pain points. AI tools can quickly surface background information, common terminology, and emerging trends, helping researchers ask smarter, more targeted questions from the start.
Together, these capabilities reduce ramp-up time and improve the quality of CX research, without sacrificing the critical thinking and human oversight required to make the results meaningful.
Human Insight Remains Essential
While AI can identify themes and patterns, it can’t fully explain the “why” behind customer behavior. Especially in B2B, where context is everything, human analysts are still essential for interpreting results and making strategic decisions.
AI can detect patterns, cluster sentiment, and surface anomalies, but it lacks the nuanced understanding of context, intent, and emotional drivers. That’s where human insight comes in.
In particular, B2B environments are filled with complexity: multi-stakeholder relationships, long buying cycles, and layered motivations. AI may flag that a key decision-maker is hesitant or disengaged—but only a skilled researcher, familiar with the industry and organizational dynamics, can connect that data point to the broader story.
Additionally, panelists emphasized that humans must validate AI-generated outputs before insights are turned into business decisions. Whether it’s refining survey questions suggested by AI or pressure-testing an emerging theme against interview transcripts, human judgment ensures accuracy, relevance, and integrity.
Ultimately, AI can get you to insight faster, but only human intelligence can ensure that insight is strategically sound and contextually correct.
Data Quality and Ethics Matter
As AI becomes more embedded in customer experience research, the panelists emphasized that data quality and ethical responsibility must remain front and center.
AI is only as good as the data it’s trained on. If your source data is biased, incomplete, or poorly structured, the insights AI produces will be misleading at best—and damaging at worst. In B2B settings, where one flawed insight can influence high-stakes decisions, bad data isn’t just inefficient—it’s a liability.
Panelists also stressed the importance of maintaining transparency with customers. Whether gathering survey responses, analyzing interviews, or using behavioral analytics, companies must clearly communicate how data will be used and ensure that privacy and consent are upheld.
Basically, the roundtable sparked some incredible insights—but it also raised broader questions about the evolving world of customer experience research.
So, what follows is more information about the methods, tools, and technologies used for B2B research and lays out more details around using AI for surveys, interviews, and journey mapping.
More about Customer Experience Research: Turning Insights Into Revenue & Retention
For industries in which products and services can seem interchangeable from one company to the next, customer experience (CX) often becomes a powerful differentiator. The theory is that premium value is built not so much around what you sell—as it is around how you sell, support customers, and forge deep long lasting customer relationships.
But great customer experiences don’t happen by chance. They’re built on insights, not intuition. And that’s where customer experience research comes in.
CX research systematically investigates how customers perceive and navigate their relationship with your brand. It uncovers friction, emotional inflection points, and unmet needs—transforming anecdotes into strategy and turning feedback into business results.
At Interaction Metrics, we’ve found that combining scientific research principles with modern AI tools leads to sharper insights and more trustworthy data. Whether it’s analyzing open-text responses, mapping experiences, or synthesizing interviews, our TrueData model ensures you’re working from facts—not guesswork.
And thanks to advancements in AI-powered tools for research, this work is now faster, more scalable, and more insightful than ever before.
What Is Customer Experience Research?
Customer experience research is the practice of collecting, analyzing, and interpreting data about how customers interact with a business across their end-to-end journey. It includes both quantitative research (like surveys and analytics) and qualitative methods (like interviews and observational studies) and focuses specifically on the customer’s experience—not just their demographics or buying habits.
To effectively conduct customer experience research, it is essential to employ both quantitative and qualitative methods to capture a comprehensive view of the customer journey.
Unlike general customer research, which often focuses on product-market fit or brand awareness, CX research zooms in on how customers feel about their interactions: where they get stuck, what delights them, and why they stay or leave.
It’s used to answer questions like:
- What are our biggest experience breakdowns?
- Where are customers losing trust or getting frustrated?
- How can we turn good experiences into unforgettable ones?

Why CX Research Matters
- Retention Over Acquisition: It costs 5–7x more to acquire a new customer than to retain an existing one. CX research shows you where and why customers are churning—and what to do about it. By addressing these issues, businesses can create better customer experiences that drive retention and loyalty.
- Experience Is the Brand: In a commoditized market, your experience becomes your product. Two companies can sell the same software—but the onboarding, support, and service journey can feel worlds apart.
- Customer-Led Growth: Word-of-mouth, upsell potential, and brand loyalty are all byproducts of memorable experiences—rooted in a deep understanding of customer needs. According to Harvard Business Review, customers who had the best experiences spend 140% more compared to those who had the poorest.
In a commoditized market, your experience becomes your product. Two companies can sell the same software—but the onboarding, support, and service journey can feel worlds apart.
As Forsta explains, B2B companies that prioritize CX can deepen loyalty and stand out in highly competitive markets.
Core Types of Customer Experience Research
#1. Surveys
Surveys are the backbone of CX research, providing structured feedback at scale. The most common survey types include:
- CSAT (Customer Satisfaction Score)
- NPS (Net Promoter Score)
- CES (Customer Effort Score)
Surveys can be deployed post-interaction (e.g., after support), post-purchase, or at periodic intervals to gauge the health of customer relationships. In addition to surveys, focus groups can provide in-depth insights by facilitating direct conversations with customers.
Use Case: A subscription company uses monthly NPS surveys to track sentiment trends across onboarding, support, and renewal.
#2. Customer Interviews
Interviews offer a rich, conversational look at customer perceptions. They allow researchers to probe for deeper insights, uncover latent needs, and pick up emotional signals that surveys can miss.
Use Case: A B2B manufacturer interviews long-term clients to understand why repeat orders have slowed—revealing issues with documentation and perceived product complexity.

#3. Customer Journey Mapping
Journey mapping translates feedback and behavioral data into a visual timeline of the customer’s experience. These maps show each stage of the journey, identify friction points, and highlight emotional inflection areas. Mapping the full customer journey helps businesses capture every interaction and touchpoint, providing a holistic view of the customer experience.
Use Case: A logistics firm discovers that customer frustration peaks not during delivery—but during quoting. They revamp the quoting interface, reducing service tickets by 30%.
#4. Usability Testing
This method is essential for digital products. It evaluates how intuitive your interfaces are and where users get stuck, click away, or make errors.
Use Case: A SaaS firm watches users try to complete a task inside its dashboard and realizes that poor labeling is causing repeated drop-off.
#5. Ethnographic and Observational Research
By watching customers in their natural settings—at work, on job sites, or using your product—you can uncover real-world workarounds, missed opportunities, and contextual challenges.
#6. Review and Feedback Analysis
Online reviews, support transcripts, and internal forms often hold unfiltered, candid commentary from customers. These are rich sources of CX data—especially when analyzed using AI for research tools.
#7. Support Ticket and Chat Analysis
Analyzing support logs reveals common pain points, tone of interactions, and knowledge gaps. In AI in B2B environments, NLP tools can analyze transcripts across product lines and departments to surface cross-functional issues.
#8. Behavioral Analytics
Using tools like FullStory, Heap, or Google Analytics, you can track how users interact with your digital properties—clicks, scrolls, hesitations—and combine this with survey data to contextualize CX issues.
Customer Experience Management
Customer Experience Management (CEM) is a strategic approach that focuses on designing and responding to customer interactions to meet or exceed their expectations. It involves a deep understanding of the entire customer journey, from the first point of contact to post-purchase support, ensuring a positive customer experience at every touchpoint. Effective CEM is crucial for increasing customer satisfaction, loyalty, and retention.
By conducting thorough customer experience research and gathering direct feedback, businesses can pinpoint areas for improvement and optimize their customer service teams to deliver exceptional service. This structured approach not only enhances the overall customer experience but also drives business growth by fostering long-term customer relationships. In essence, CEM is about creating a seamless and positive customer journey that aligns with customer expectations and business goals.
Customer Centricity
Customer centricity is a business philosophy that places the customer at the heart of all decision-making processes. It involves a comprehensive understanding of customer needs, expectations, and behaviors to create a consistently positive customer experience. Companies that embrace customer centricity leverage customer data and insights to inform their marketing teams and drive strategic business growth.
By focusing on customer centricity, businesses can build empathy with their customers, fostering a deeper connection and loyalty. This approach not only helps in retaining existing customers but also attracts potential customers by demonstrating a commitment to meeting their needs. In a competitive market, customer centricity is essential for staying ahead and driving revenue, as it ensures that every business decision is made with the customer in mind.
Customer Experience Insights
Customer experience insights are the valuable knowledge and understanding gained from conducting comprehensive customer experience research. This involves analyzing customer data and feedback to identify patterns, trends, and areas for improvement. By leveraging these insights, businesses can gain a deeper understanding of customer needs, preferences, and behaviors, which is crucial for creating a positive customer experience.
Utilizing customer experience insights allows businesses to make informed decisions that drive business growth. These insights help identify pain points in the customer journey, enabling companies to address issues proactively and enhance the overall customer experience. In today’s data-driven world, customer experience insights are indispensable for businesses aiming to stay competitive and deliver exceptional service.
The Importance of Customer Data
Customer data is a critical asset for businesses aiming to understand their customers and create a positive customer experience. This data is collected from various sources, including customer interactions, feedback, and behavior, providing a comprehensive view of the customer journey. Analyzing customer data helps businesses identify patterns, trends, and areas for improvement, which are essential for crafting targeted marketing campaigns and enhancing customer satisfaction.
By leveraging customer data, businesses can drive significant growth, increase customer satisfaction, and build a loyal customer base. Customer data is a cornerstone of effective customer experience management, enabling companies to stay ahead of the competition by making data-driven decisions that align with customer expectations. In essence, understanding and utilizing customer data is key to creating a positive customer experience and achieving long-term business success.
AI and the Future of Customer Experience Research
AI is not replacing human researchers—it’s amplifying them. Here’s how intelligent systems are redefining how we collect and act on CX data.
Machine learning algorithms can predict customer behaviors and optimize marketing efforts, enhancing the overall effectiveness of customer experience research.
AI for Surveys
AI for surveys enhances every stage: question design, deployment, analysis, and follow-up.
- Smarter Survey Design: AI can pre-test your surveys, flagging leading or confusing questions, and suggesting improvements to reduce bias. It even adapts language based on audience demographics or region.
- Open-Text Analysis at Scale: NLP tools analyze thousands of comments, clustering responses by sentiment, theme, or urgency. They distinguish between “mildly annoyed” and “about to churn”—making your follow-up more precise.
- Predictive Segmentation: AI can flag respondents who exhibit patterns linked to future churn or upsell potential, so you can take action proactively.
- Language Intelligence: AI translates and localizes surveys without losing intent or emotional nuance, allowing truly global CX insights.
Example: A global software company analyzes NPS verbatims across six regions. AI finds that customers in Europe mention “transparency” 3x more often, prompting a new communications initiative.
AI for Interviews
AI for interviews turns hours of recordings into actionable insights without sacrificing nuance.
- Automated Transcription: AI transcribes interviews with high accuracy, tagging pauses, inflections, and emotional tone.
- Emotion Detection: Tone analysis reveals when a customer is holding back, unsure, or deeply engaged. This adds a deeper emotional layer to the data.
- Thematic Summarization: AI distills long interviews into concise summaries organized by theme, complete with timestamps and relevant quotes.
- Cross-Interview Synthesis: Instead of manual coding, AI scans multiple interviews at once to surface trends, contradictions, or standout insights.
Example: A distributor conducts 30 interviews with its top B2B accounts. AI finds that customers consistently mention confusion over part compatibility. The company updates its digital catalog with smart filters, reducing tech support calls by 22%.
AI for Digital Journeys
Digital behavior offers clues surveys can’t capture—and AI decodes these clues in real time.
- Behavioral Triggers: AI watches cursor paths, rage clicks, exit timing, and form drop-offs to pinpoint moments of confusion or frustration.
- Real-Time Nudges: Based on behavior, AI can prompt help—offering live chat, dynamic tooltips, or reassurance messages at exactly the right time.
- Conversion Predictions: AI models assess digital body language and forecast likelihood to convert, enabling better remarketing and support prioritization.
Example: An insurance platform detects that users viewing quotes late at night are more likely to abandon the process. AI schedules a follow-up email for early morning with a single-click reactivation button—boosting completed applications by 18%.
AI for Journey Maps
AI for journey maps transforms static visuals into living, evolving CX dashboards.
- Dynamic Journey Detection: AI doesn’t rely on hypothetical customer paths—it builds journey models from real behavioral data, including detours and loops.
- Layered Data Visualization: Customer feedback, support logs, usage data, and operational KPIs are overlaid on the journey map, providing a 360° view.
- Friction and Delight Hotspots: AI highlights exactly where satisfaction dips, complaints spike, or customer delight increases—so teams know where to intervene.
- Intelligent Recommendations: Based on journey breakdowns, AI suggests actions—like adjusting messaging, improving handoffs, or simplifying steps.
Example: A B2B SaaS firm notices that NPS scores dip after the third login. AI-augmented journey maps reveal that this step aligns with the customer’s first usage of advanced settings—prompting the creation of a tutorial video and a welcome checklist.
How to Build a CX Research Strategy
- Define Clear Objectives: Start with business problems. Don’t do research for research’s sake—anchor it to outcomes like reducing churn, improving onboarding, or growing referrals. A well-defined CX strategy ensures that research efforts are aligned with business goals and customer needs.
- Segment Your Audience: Different personas, industries, and value tiers experience your company differently. Segment your research and analysis accordingly.
- Choose Mixed Methods: Use surveys, interviews, reviews, and behavioral data together to get a holistic picture.
- Embed Across the Lifecycle: Measure experiences at key lifecycle stages—onboarding, renewal, escalation—not just annually.
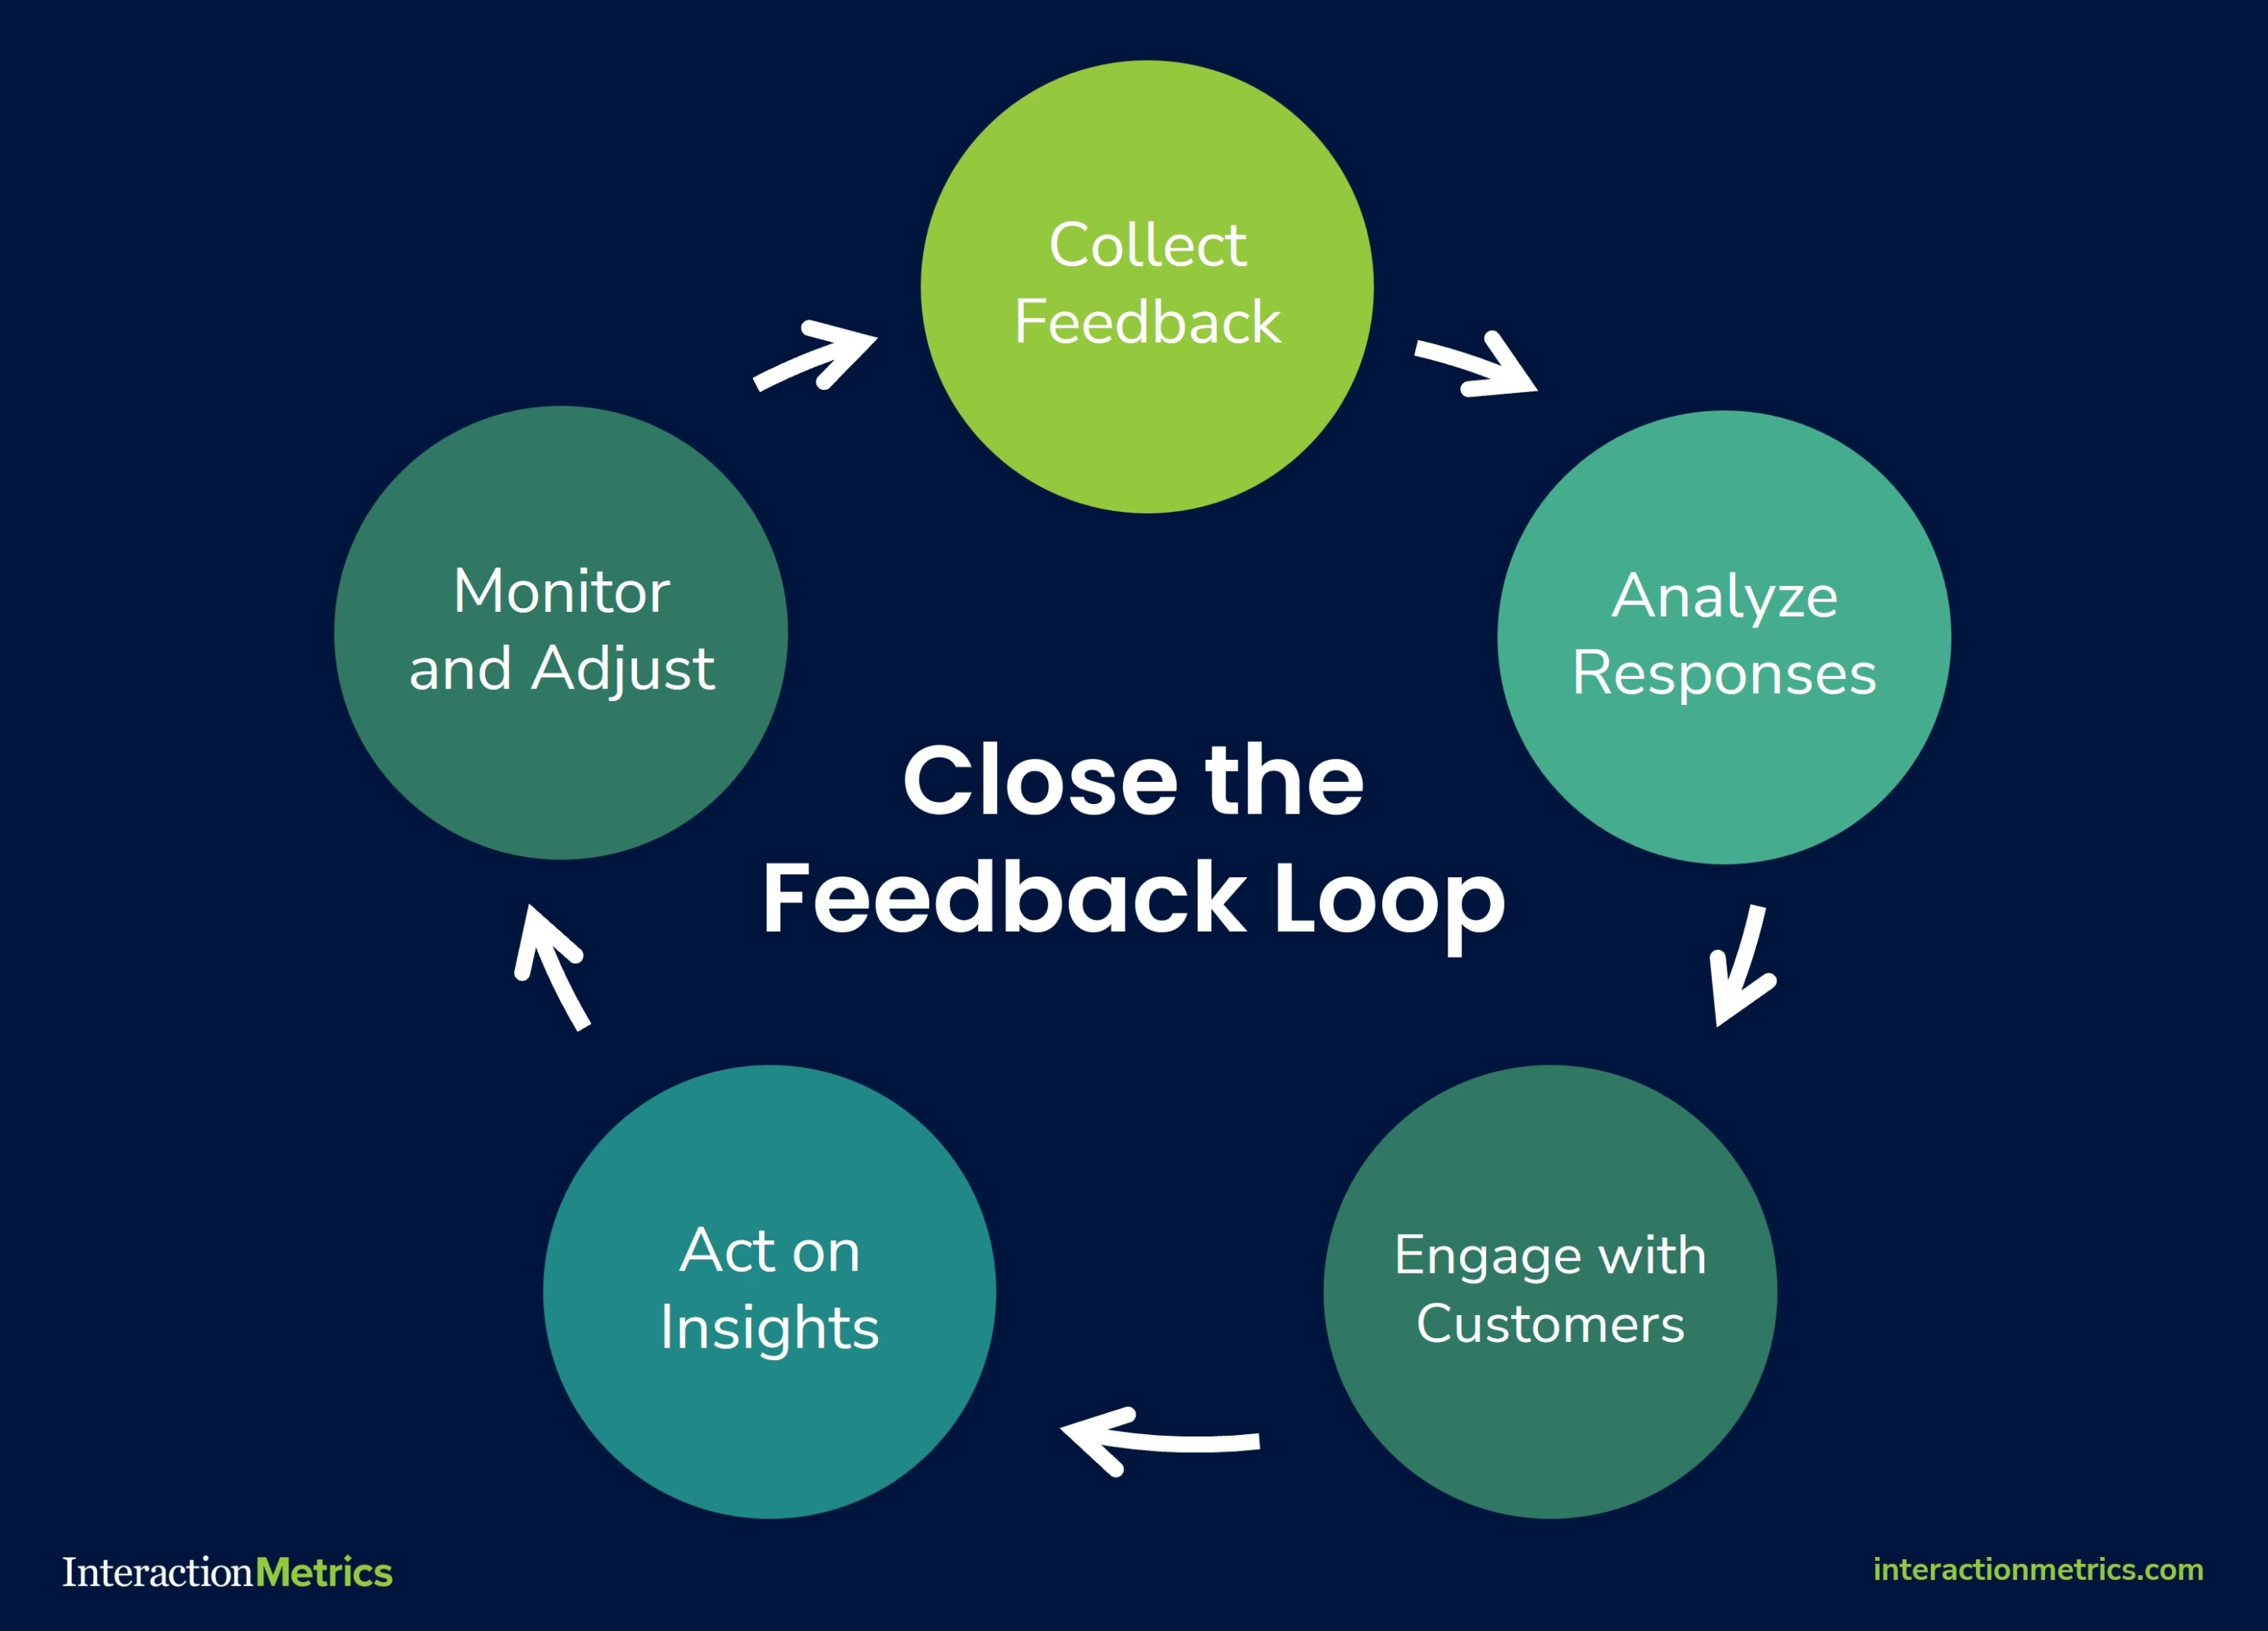
- Close the Loop: Tell customers how you’re acting on their feedback. It builds trust and increases future participation.
CX Research for B2B Companies
B2B research is often more complex—and more valuable. Buyers are part of teams, journeys are longer, and contracts are higher stakes.
- Use AI in B2B to map multi-contact touchpoints.
- Use interviews to understand not just users—but decision makers, influencers, and end customers.
- Use journey analytics to track long lead-to-close paths.
Common Pitfalls to Avoid
- Over-relying on surveys and ignoring behavioral or emotional data. Customer experience research is constantly evolving, and staying updated with new techniques and technologies is essential to avoid these pitfalls.
- Failing to segment properly, lumping all customers into one bucket
- Letting insights go unused, damaging customer trust
- Using biased or vague questions, leading to flawed conclusions
- Treating journey maps as one-time projects instead of dynamic assets
The Future of Customer Experience Research
- Emotion AI will add facial expression, voice tone, and biometric cues to deepen our emotional understanding of the customer.
- Predictive Personalization will use CX research to tailor experiences in real time—at the individual level.
- Unified CX Intelligence Platforms will connect surveys, CRM, behavioral data, and AI into one actionable dashboard. Innovation in AI and data analytics will continue to drive advancements in customer experience research, providing deeper insights and more effective strategies.
Conclusion: Research That Drives Results
Customer experience research is no longer a side project. It’s the foundation of customer-centric growth.
Whether you’re exploring friction in onboarding, studying digital behaviors, or running interviews with key accounts, the smartest companies use CX research to stay ahead.
And now, with AI for surveys, AI for interviews, and AI in B2B, you can gather richer insights, faster—and act with clarity.
Listen better. Act faster. Exceed expectations.
For brands, delivering exceptional customer experiences is crucial for building a positive reputation and fostering customer loyalty.
That’s the power of customer experience research.
============================================
Care to discuss customer surveys, analysis, or any kind of CX research? Get in touch!
============================================
The post B2B Customer Experience Research—Latest CXPA Roundtable appeared first on Interaction Metrics.
]]>Read more
The post 22 Best Practices for Surveys: Tips for Writing, Design, and Analysis appeared first on Interaction Metrics.
]]>You’ve probably been on the receiving end of a bad survey.
Maybe it asked you to rate a delivery you never received. Or it forced you to choose between three irrelevant response options, none of which applied to you.
Or perhaps you actually took the time to explain a problem in your own words, and no one followed up.
These moments damage brands as much as they annoy respondents.
They’re a testament to the fact that online surveys are everywhere, but most are careless, biased, or just plain useless.
Even worse, a poorly executed survey will fail to represent your population at large. It will nag rather than invite, and worst of all, won’t gather actionable insights and KPIs.
At Interaction Metrics, we believe the survey process should be treated like any other mission-critical business function: with discipline, accountability, and respect for survey participants.
This article shares the exact best practices we use to guide our own survey designs. They’re the same methods we use every day to help clients collect reliable data and make confident business decisions.
If you’re looking for a partner who handles every step, from identifying your target population to interpreting your survey data, get in touch. We’d love to hear about your survey goals.
Best Practices for Writing Good Survey Questions
Most surveys fail because the questions were flawed from the start.
They’re too long. They introduce bias. They sound like they were written without any real thought about the target audience. They chase too many topics, and the data collected ends up shallow, scattered, and hard to act on.
In this section, we’ll look at how to write a good survey questionnaire that avoids common flaws so you can ask clear, neutral questions that provide accurate answers and meaningful data.
1. Start With a Clear Goal
Every survey project should begin with a crystal clear goal.
“Get feedback” isn’t a goal.
“Figure out whether our new onboarding flow is frustrating customers” is.
If you’re trying to cover multiple unrelated topics (like onboarding, pricing, and customer support), split them into separate questions.
Or better yet, create a survey for each topic. This way, you’ll know the details to improve in specific areas.
Takeaway: Before you write your first question, determine exactly which business decisions the survey needs to support.
A good goal does two things:
- It ties directly to a decision you’re trying to make.
- It defines what should—and shouldn’t—be part of your survey design.
Before you move forward, write down your survey’s goal in one complete sentence. If you can’t do that, you’re not ready to write the survey.
2. Ask Compelling (but Non-Leading) Questions
A well-written survey question should walk a fine line: It needs to be interesting enough for the survey respondent to want to answer, but neutral enough not to shape how the respondents answer.
One common mistake is question wording that pushes people toward a specific opinion.
For example, “How satisfied were you with our helpful and knowledgeable staff?”
Questions like this assume the staff was both helpful and knowledgeable.
Instead, try something like “On a scale of 1-5, how would you rate your interaction with our staff?”
This uses a clear response scale, gives room for a range of answers, and doesn’t suggest a preferred outcome.
When drafting your questions:
- Avoid emotionally loaded terms like “amazing” or “excellent.”
- Stick to clear response categories (e.g., “Very satisfied” to “Very dissatisfied”)
- Use multiple-choice questions with mutually exclusive options
Once you’ve written a draft, test it with someone not involved in your survey research.
Ask them:
- Were there any questions where you felt nudged to respond a certain way?
- Did you think any of the wording assumed how you felt?
- Did any questions feel hard to answer honestly?
What feels neutral to you might sound pushy to someone else, especially if they’re not thrilled with your service.
If your goal is to understand the truth, your job is to make every question feel safe, simple, and judgment-free.
3. Keep Your Survey Focused On One Topic at a Time
Every question in your survey should point toward the same research goal.
This is critical when you’re dealing with self-administered surveys, where there’s no interviewer to guide the flow.
If you veer off-topic, you risk losing your survey participants’ attention.
Say your survey mode is email, and you’re trying to evaluate your new onboarding flow.
Halfway through the survey, you suddenly ask: “How satisfied are you with our pricing?”
Now the survey respondent is shifting gears, thinking, “What does pricing have to do with onboarding?”
Their answer might be valid, but it doesn’t serve your objective. It introduces noise instead of clarity.
This is different from double-barreled questions (which we’ll cover shortly).
Here, we’re talking about maintaining focus across the full survey, so every question fits together in a coherent, logical order.
If you’re tempted to squeeze in unrelated feedback, ask yourself: “Do I need another question—or an entirely different survey?”
4. Use Natural, Conversational Language
Customers don’t say things like “I somewhat disagree.”
They say, “Not really” or “It was okay.”
The language you use in your questions—and especially your response categories—should reflect how people really talk.
The more natural the phrasing, the more likely survey respondents are to give honest, thoughtful answers.
Instead of:
- “Please indicate your level of satisfaction with our service representative.”
Try:
- “How would you describe your experience with our team member?”
Even your closed-ended questions should use plain, everyday language. Options like “Bad,” “Okay,” and “Great” are easier to interpret than formal phrases like “Strongly Disagree” or “Very Dissatisfied.”
If your question wording feels stiff or confusing, you’ll either lose people entirely or collect data that doesn’t reflect reality.
At Interaction Metrics, we’ve seen this play out time and again: When questions sound human, customers give more thoughtful answers.
When they sound robotic, customers either drop off or speed through.
5. Avoid Double-Barreled Questions
Double-barreled questions ask about two different things in the same question—but only allow one answer.
Example: “Was your waiter prompt and polite?”
That might sound harmless, but what if the waiter was fast and rude?
The same question is trying to measure two behaviors. And now your data collection is flawed.
These questions cause confusion, harm data quality, and make it impossible to accurately measure what your customer really experienced.
But it’s not the same as asking a leading question. Leading questions steer people toward a specific answer. Double-barreled questions cram multiple concepts into one sentence and force a single response.
To fix it, just separate the topics:
- “How would you rate the promptness of the service?”
- “How would you rate the politeness of the staff?”
6. Ask Only Relevant Questions
If a question doesn’t apply to someone, don’t make them answer it.
Say you’re asking about gym habits.
If a respondent doesn’t go to the gym, asking them how often they attend or what equipment they use just feels sloppy.
That’s where question logic comes in.
Also called branching or skip logic, it means you only show questions based on how someone answered earlier ones. If they didn’t use your mobile app, don’t ask five questions about it.
If your survey software doesn’t support logic, at least include a “Not applicable” option.
If you don’t, you introduce bias that can tank your data quality.
This matters even more when you’re asking about sensitive subjects like medical history, gender identity, or demographic information. If a question just doesn’t apply, your survey needs to respect that.
This is one of the core principles behind best practices survey design: relevance improves honesty, and honesty improves outcomes.

7. Let Customers Answer Anonymously
About half of all survey participants prefer to remain anonymous. When you give them that choice, you’re far more likely to get detailed, honest answers, especially when you’re covering sensitive questions or potentially sensitive topics.
But doesn’t anonymity conflict with segmentation?
Not if you design your survey correctly.
You don’t need someone’s name to group them meaningfully.
Here’s how:
- Use early questions to capture demographic information, behaviors, or product usage
- Allow people to skip identity-related questions if they choose
This lets you segment results without sacrificing anonymity or trust.
In fact, anonymous surveys help minimize bias, especially when dealing with qualitative research methods like open-ended questions or focus groups.
When you pair anonymity with smart research methods, like conducting cognitive interviews during testing, you dramatically improve the honesty and reliability of your survey results.
8. Consider Not Sending a Survey at All
Surveys are powerful, and there are many different kinds. But depending on your goal, they’re not always the right tool.
If you’re trying to understand why customers feel a certain way or explore how they interpret a sensitive subject, sometimes other research methods work better than a digital or paper survey.
Use interviews when you need depth.
Live conversations allow for follow-up questions and nuance. They’re ideal when you’re dealing with emotion, complexity, or context that’s hard to capture in a closed-ended question.
Use usability studies when you’re testing processes.
You can ask people what they think of your website, or you can watch them use it. Watching gives you real-time insight that most surveys can’t provide.
Use personal outreach when you need quick feedback.
If you’re looking for input from a specific segment, like recently churned customers, skip the survey.
A short, focused email or call often leads to richer insights.
Use Service Evaluations when you need to have better interactions with customers. They’re useful when you want an in-depth examination of your call, chat, and email conversations—and want to know how to get more value from them.
If you notice the following signs, it’s worth considering if you’d be better off skipping the survey altogether.
- No matter what you’ve tried, no one responds to your surveys, or your customer/employee database is tiny to begin with.
- You’re not learning anything new from your surveys.
- You’re tackling topics that are personal, emotional, or complex.
Choosing the right method upfront saves you time, protects customer goodwill, and leads to stronger, more actionable insights.
Best Practices for Good Survey Sampling
Even the best-written survey won’t help if you’re asking the wrong customers —or the right customers in the wrong proportions.
Sampling doesn’t get much attention. It’s not shiny. But it’s the foundation of trustworthy data.
Get your sample wrong, and everything else collapses.
Sample too small? Your data won’t represent your customer base. You’ll make decisions based on outliers, not trends.
Sample too big? You might waste time and money collecting more survey responses than you need without gaining any detailed information that leads to clarity.
Worse, many companies fall into the habit of surveying only the easiest-to-reach customers—recent buyers, email openers, loyal fans. That creates a false sense of confidence while overlooking the quiet churn risks or casual users who see your business differently.
If you want reliable insights and segmented results you can act on, you need a sample that reflects the full spectrum of your customer base.
9. Survey the Right Customers (Or Employees)
You can’t improve the customer experience if you only hear from your happiest customers or employees.
For example, a good customer sample includes:
- Your newest customers
- Multi-year repeat buyers
- Those who’ve stopped engaging
- Customers who’ve never contacted support
- Customers who always contact support
Each of these groups experiences your business differently.
If you don’t hear from all of them, your survey data becomes lopsided, and your decisions follow suit.
And here’s the bigger point: without a mix of perspectives, you lose the ability to segment your results.
Segmentation lets you break down feedback by:
- Customer tenure (new customers vs. longtime customers)
- Behavior (heavy users vs. occasional users)
- Demographics (age, region, income, etc.)
It’s how you find out if first-time buyers are struggling with your sign-up flow. Or if high-value customers are quietly getting frustrated over a UX issue you had no idea existed.
No segmentation means no context. And without context, your survey is just a pile of averages.
10. Calculate the Correct Sample Size
It’s tempting to just survey whoever’s easiest to reach.
Don’t.
You need enough responses to make your data statistically valid—and evenly distributed enough to represent your whole customer base.
Here’s what that means:
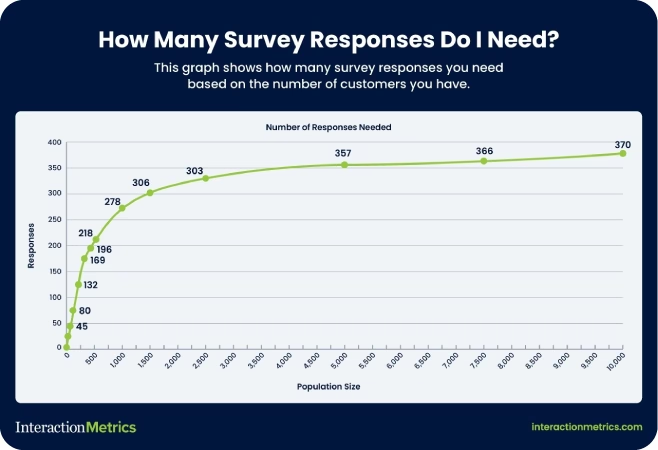
- Generally speaking, the bigger your customer base, the larger your sample needs to be – up to about 370 responses per population.
- Margin of error and confidence levels aren’t technical fluff; they tell you if your results reflect reality.
Not sure how many responses you need? Use Interaction Metrics’ free Sample Size Calculator. It only takes 30 seconds to learn a whole lot more about what your survey really needs.
11. Randomize Your Outreach Whenever You Can
If your survey only goes to people who clicked your last email, you’re already working with a skewed sample.
Randomizing your outreach means every customer has an equal shot at being included, not just the people who are most engaged or easiest to reach.
Even simple randomization (like choosing every 10th customer on a list) can go a long way toward protecting the integrity of your data.
12. Use Quotas to Balance Customer Types
Randomization helps, but sometimes you need to go a step further.
Quotas let you control how many responses you get from each customer segment, so you don’t over-represent one group while leaving another out.
Examples of quotas (depending on how many subjects you have):
- 25% of responses from new customers
- 25% from long-time customers
- 25% from inactive users
- 25% from churn risks
This doesn’t mean you reject responses once a group hits its quota. But it does mean you proactively seek out underrepresented voices until you’ve got a balanced view of your audience.
The result? Data that shows you not just the average, but the differences between groups.
13. Monitor and Adjust As Responses Come In
Sampling isn’t “set it and forget it.”
You might start out with a randomized list or a balanced quota plan, but if certain groups don’t respond as expected, your sample can still go off-course.
That’s why it’s important to monitor your response patterns in real time.
If you notice that:
- Responses are coming mostly from one demographic,
- A particular segment isn’t participating,
- Or you’re trending too heavily toward one behavioral group…
Pause and recalibrate.
That could mean:
- Sending a reminder to only a specific subgroup
- Extending the window for lower-response segments
- Offering an incentive just to the group that’s underrepresented
Remember: you’re aiming for coverage, not just volume.
A great sample isn’t one that fills up fast. It’s one that tells the full story.
Best Practices for Survey Invitations
How you invite customers to take your survey says everything about how much you value their time and opinions.
A bad invite feels like spam.
A great one feels like an opportunity.
Here’s how to craft survey invitations that people want to answer.
14. Craft a Human, Personalized Survey Invite
If your survey invitation comes from “noreply@company.com,” you’ve already lost.
People don’t want to be talked at. They want to be spoken to.
Good invites:
- Come from a real person’s name and email address.
- Thank the customer for spending their time completing the survey
- Are specific about why the customer’s feedback matters.
The idea is simple: show your customers you respect their time before you ask for more of it.
15. Write Warm, Creative Subject Lines
Want your survey email to get deleted immediately?
Generic subject lines scream “bulk email.” They kill your open rates before you even get a chance.
Better options:
- Focus on customer impact: “Help shape your next experience.”
- Highlight a small reward: “We’d love your opinion—coffee’s on us.”
- Make it intriguing: “Got 60 seconds? We’ll make it worth it.”
Skip the word “survey” altogether if you can. Customers should feel like they’re joining a conversation, not completing a chore.
16. Offer Thoughtful Incentives (Without Overpromising)
Incentives are a great way to increase response rates—but only if they feel genuine.
Nobody believes they’ll win a $500 Amazon gift card for taking a survey. And even if they did, dangling big prizes can cheapen your brand.
Instead, small, guaranteed gifts show real appreciation.
Try offering a modest Starbucks card. A discount code. Early access to a new feature.
Interaction Metrics has seen success with “a latte on us” style incentives. Small surprises create positive reciprocity without making you sound desperate.
17. Actively Listen and Follow Up with Respondents
The moment someone completes your survey, the relationship changes.
They’ve invested time. They’ve told you something real. Now you owe them something back.
Even a small follow-up makes a huge difference. Customers don’t expect instant changes. But they do expect to know they were heard.
Fail to follow up, and they’ll never bother answering your next survey.
Good surveys start with a good invitation. They end by showing that someone on the other side was actually listening.
Best Practices for Analyzing Survey Data
A finished survey isn’t the end of the process. It’s the start of decision-making.
But that only works if the way you analyze the data is just as thoughtful as the way you designed the survey. Otherwise, you’re making business decisions on bad math, shallow insights, or noise.
Here’s how to avoid that.
18. Pre-Test Before You Launch (And Read the Results Like a Customer Would)
Yes, you should test your survey with a small group before sending it out.
But don’t just look for typos or broken logic. Pay attention to the actual experience of taking the survey.
- Do the questions flow naturally?
- Are any answer options missing?
- Are there moments where people hesitate to answer or feel boxed into a specific response?
Ask testers what they thought you were trying to learn after they’ve seen your survey.
Clarity is everything—both for the person answering and the person reading the results. If their answers don’t match your actual goal, rewrite your questions.

19. Break Down Your Results by Segment
If you want to understand your customer experience, you have to see how different groups are experiencing it differently.
Start by segmenting your results:
- New vs. longtime customers
- High-value vs. low-value buyers
- Different age groups or regions
- Different product or service lines
Maybe new customers love the onboarding, but longtime users are frustrated with upgrades. You’ll never see that if you lump everyone together in a single group.
If you’re serious about improving the experience, you need to know who is thriving—and who is struggling.
20. Visualize the Data
Averages smooth out the bumps—but those bumps are where the real problems live.
Instead of just looking at the mean score, visualize the full spread of your data.
Tools like histograms, scatterplots, or simple bar charts can show you:
- Whether responses cluster around a few scores
- Whether there’s a big gap between satisfied and dissatisfied customers
- Whether there’s a silent middle that might be getting overlooked
21. Study the Extremes to Spot Hidden Patterns
Your most passionate customers—whether they’re thrilled or furious—often know something others don’t.
Once you have your distribution mapped, study the extremes:
- What do the happiest customers have in common?
- What do the angriest ones share?
Are the frustrated customers mostly new users? Is one product line dragging down satisfaction across the board?
Extreme responses often surface issues that averages smooth over. They’re not noise. They’re signals—if you know how to look for them.
22. Focus on What the Data Tells You to Do Next
Survey data should lead to action.
But that doesn’t mean implementing every customer suggestion. It means spotting the friction points your team can address and doing something about them.
After every survey, your team should be able to answer:
- What’s the biggest issue this data revealed?
- Who does it affect the most?
- What would happen if we fixed it?
Then share a summary with your respondents. Tell them what you learned. Tell them what’s changing.
That’s how you close the loop and keep them willing to answer your next survey.
Discover a Smarter Way to Run Surveys
Interaction Metrics is a leading survey company that believes surveys should do more than check a box. They should uncover the truth—clearly, accurately, and without bias.
That’s why we created the TrueData method.
It’s our end-to-end model for building surveys that actually lead to better decisions. With TrueData, you get more than a metric—you get a roadmap for improvement.
Here’s how the TrueData method delivers actionable insights you can use to improve the customer experience.
1. True-Facts: Scientifically Valid Questions
Every survey we run is custom-built around your goals.
We use a proprietary 20-point bias checklist to eliminate flawed constructs like leading language, irrelevant questions, and skewed answer options. That means you get honest, actionable insights—not just noise.
2. True-Tech: Enterprise-Grade Tools (Handled for You)
We license and manage best-in-class tools like Qualtrics, Alchemer, and SPSS.
No training. No extra fees. No DIY dashboards.
Just clean, professional survey deployment and analytics—handled entirely by our experts.
3. True-Insight: Advanced Analysis That Drives Action
Once the data comes in, we go beyond top-line stats.
We segment results. Analyze text. Surface patterns in the extremes. And give you plain-English reporting with real recommendations you can implement right away.
If you’re ready to stop guessing and start gathering survey insights you can actually use, let’s talk. Connect with the Interaction Metrics team to learn how the TrueData method can help you get more out of your surveys.
Frequently Asked Questions
What is the best rating scale for a web survey?
The best rating scale for online surveys is a 5-point or 7-point Likert scale. These scales offer enough variation for respondents to express their opinions clearly without feeling overwhelmed by too many options.
What is the difference between closed-ended questions and open-ended questions?
Closed-ended questions provide a fixed set of answer choices, such as multiple-choice or rating scales, making data easier to quantify. Open-ended questions allow respondents to answer in their own words, giving you richer, more detailed feedback that is harder to analyze at scale.
Can I ask demographic questions if my survey is anonymous?
Yes, you can ask demographic questions on an anonymous survey. Avoid asking members of your survey population for personally identifiable information like full names or emails. Focus on general attributes like age range, gender identity, or region.
What are the different types of biased questions on surveys?
The most common types of biased questions on surveys include leading questions, double-barreled questions, loaded questions, and forced-choice questions. Learn more about the different types of bias here.
============================================
Care to discuss your next survey? Get in touch!
============================================
The post 22 Best Practices for Surveys: Tips for Writing, Design, and Analysis appeared first on Interaction Metrics.
]]>Read more
The post What Is Customer Effort Score (CES) & Why Does It Matter? appeared first on Interaction Metrics.
]]>Customer Effort Score (CES) measures how hard it is for your customers to get help from your customer service teams. And if you’ve ever had a hard time canceling a subscription or fixing a billing issue, you know exactly why it matters.
Has this ever happened to you? You clicked through five help articles, waited on hold for 20 minutes, and answered the same question twice.
At that point, you’re well beyond annoyed and ready to give up.
That’s where Customer Effort Score (CES) comes in. You can use it to gauge which processes are frustrating for customers and how to remove that friction.
Introduced by Matt Dixon and Corporate Executive Board (CEB) in 2010, CES is now a core metric in many customer experience programs.
CES has a clear purpose, but it’s often misunderstood.
Some companies automate their CES surveys. They send them out after every interaction, regardless of context, and that in itself is a source of customer frustration.
Others drop CES into customer feedback programs without giving much thought to question design or survey timing.
The problem with this approach is that you’re left with a flood of surface-level data that’s easy to ignore and hard to act on. Companies that measure CES like this are missing the point of CES entirely, which is to find friction and fix it—not to create more friction.
That’s why we take a different approach.
Interaction Metrics is a leading survey company. We’ve seen how strategically measuring your customer effort score can reveal moments of struggle that other metrics miss.
We focus on asking the right question at the right time, using survey methods that eliminate bias and deliver meaningful insight.
Because when you understand where customers are getting stuck, you can improve service, reduce churn, and build loyalty without overwhelming your team.
Here’s everything you need to know about CES: how it works, why it matters, and how you can use it to create loyal customers who stick around for the long haul.
When you’re ready to start measuring your CES score, reach out to Interaction Metrics.
What Is Customer Effort Score (CES)?
Customer Effort Score (CES) measures how easy it is for customers to get help or complete a task when interacting with your company.
Unlike NPS (which measures loyalty) or CSAT (which gauges satisfaction), CES focuses on one thing: effort.
One way to measure effort is to ask after an interaction (like a support call or a purchase), like:
“How easy was it to handle your issue today?”
“How easy was our shopping cart?”
“How easy was your onboarding experience?”
Then you might use a 5-point, 7-point, or an emoticon scale, with the left anchor being very difficult and the right anchor being very easy. That’s it. One question. One number. And when asked at the right time, CES can uncover friction that other customer service metrics miss.
But there is another way to measure customer effort, which tends to be more accurate.
You take all the questions in your survey that imply customer effort, and calculate the average of all those variables. These could be rating questions about agent clarity, website navigation, or time-to-respond.
So instead of asking your customer if something was easy, you determine the overall ease of doing business with your company. Whether to use one question or look at variables globally depends on your objectives and what you need to know.

Why Customer Effort Score Matters for Customer Satisfaction
Your customers are busy. They have options. If dealing with your business feels complicated or frustrating, they’ll move on to competitors who offer simpler interactions.
That’s why Customer Effort Score (CES) matters so much for overall customer satisfaction.
Unlike other customer experience metrics, CES doesn’t measure how happy or loyal someone feels. It measures how hard they had to work to get what they needed.
As Bill Price, co-author of The Best Service Is No Service, famously argued, the best customer service is the one customers never have to use.
Here’s why.
- High Effort Service Interactions = Lost Customers: The harder it is to get help, the faster customers leave. Gartner found that 96% of customers who face high-effort service experiences become disloyal customers.
- Low Effort Builds Loyalty: When things feel easy, customers stick around. Providing customers with a low-effort experience leads to higher retention, more spending, and more referrals. It encourages customers to stick around and speak positively about your brand.
- CES Predicts Future Purchase Behavior: Low effort means customers are likely to buy again. High effort can signal that churn is just around the corner. Depending on the product or service, customers who feel too much friction are likely to cease buying from you altogether.
- Less Effort = Better Customer Engagement: The less effort customers spend solving problems, the more likely they are to explore your products and engage with your brand.
- You Can Identify and Remove Pain Points: CES shows exactly where customers feel stuck, whether that’s a clunky checkout, a confusing help center, long wait times, or handoffs between multiple departments.
- Reduce Customer Service Costs: When customers can help themselves, support requests go down. Fewer calls and fewer tickets translate to lower customer service costs.
CES isn’t a metric to take lightly. It reveals the truth about customer friction, and addressing it can take your entire customer experience to the next level.
If you want satisfied customers who stay, spend more, and recommend your business, reducing customer effort must be a core part of your strategy.
When to Use a Customer Effort Score Survey
Timing matters with CES.
If you send surveys too randomly, you’ll miss the exact moments when effort is highest. When you send them at the right time, CES surveys reveal where your customers struggle and how to fix it.
Here are the best times to send a CES survey, with real-world examples:
1. After Customer Support Interactions
Send a CES survey after a client chats with your customer support team or calls in for help.
Example: A customer contacts customer support to dispute a charge. Once the issue is resolved, send a CES survey and be sure to include at least one open-ended question so you can understand what’s driving your scores.
2. Following a Purchase or Transaction
Send a survey after checkout to learn how smooth the buying experience was.
Example: A customer buys a subscription online. After the confirmation email, follow up with a CES question asking how easy it was to complete the purchase.
3. During Onboarding Processes
Use CES to check if your onboarding process makes sense to new users.
Example: A new customer signs up for your platform and completes the setup wizard. After setup, ask how easy it was to get started.
4. After Using Self-Service Options
Test whether your help center, chatbot, or FAQ is actually helpful.
Example: A customer uses your help center to figure out how to reset their password. Show a CES question after they’ve finished the article to gauge the experience.
5. When Renewing or Upgrading Services
These moments often involve complex decisions or system navigation.
Example: A customer upgrades their account from a free to a paid plan. After they finish, ask how easy the upgrade process was.
6. After Addressing Specific Pain Points
Once you’ve simplified a frustrating process, check if the update worked.
Example: You redesigned your billing page to make it easier to update credit card info. Send a CES survey right after a customer uses that page to see if the change actually reduced effort.
Measuring customer effort at targeted points throughout the entire customer journey helps customers avoid overwhelm from constant surveys, and you gain clear, actionable data to drive improvements.
Next, we’ll look closely at exactly how to measure and interpret your CES results to improve overall customer satisfaction.
How to Measure Customer Effort Score: Questions, Scales & Formulas
To get the most value from your Customer Effort Score (CES), you need clarity on how to structure your surveys and interpret the results.
Here’s exactly how to measure CES effectively:
1. Choose the Right Question Format
CES surveys typically ask one straightforward question, such as:
- “How easy was it to resolve your issue today?” (standard CES question)
- “The company made it easy to handle my request.” (agree/disagree format)
Choose wording that aligns clearly with the interaction you’re assessing.
2. Select an Effective Rating Scale
CES commonly uses one of three formats:
- Numbered Scales (most common): Usually 1–7 or 1–5 (1 = very difficult, 5 or 7 = very easy).
- Likert Scales: Customers rate their agreement with a statement from “strongly disagree” to “strongly agree.”
- Emoticon Ratings: Frowning faces for difficult interactions, neutral faces for moderate effort, and smiley faces for easy interactions.
Pick a scale that feels intuitive for your customers. Simpler scales tend to get higher response rates.

3. Calculate Your CES Score
The Customer Effort Score calculation is a simple average. Add together the total scores from all responses, then divide the total by the number of responses.
And when calculating your score, don’t forget to segment your customers so you can perform cross-tab analysis.
Breaking your customer base into smaller groups allows you to determine in what situations you’re getting particular scores, and for whom.
This way, you know you’re getting a true picture of customer effort instead of focusing on one specific group (for example, women over 50 with a bachelor’s degree) disproportionately.
Use the formula to get an average CES rating for each segment, then take the average score of each segment and use it to get an idea of overall customer effort.
Higher scores (closer to 5) indicate better customer experiences. Lower scores suggest frustration and friction.
4. Analyze Comments, Not Just Numbers
CES numbers give direction, but open-ended responses provide deeper insights.
Look carefully at customers’ written comments for common themes.
Words like “confusing,” “fast,” “frustrating,” or “easy” show exactly where your service is succeeding or failing.
What’s a Good Customer Effort Score?
A “good” CES score depends on the scale you’re using:
- On a 5-point scale, most companies aim for an average score of 4 or higher.
- On a 7-point scale, aim for 5 or higher.
If your average is creeping below those numbers, it likely means customers are encountering friction—slow response times, confusing processes, or broken self-service tools.
Here are a few points to keep in mind after calculating CES.
1. Higher Scores Are Better
Generally, you want scores on the higher end (closer to 5 or 7). Higher scores signal that your customers find interactions straightforward and frustration-free.
2. Compare to Industry Benchmarks
While there’s no universal benchmark, many companies target a CES average of around 4 on a 5-point scale (or about 5 on a 7-point scale).
If your scores are consistently lower, your customers might face unnecessary challenges.
3. Track Changes Over Time
CES is most valuable when you track it consistently and compare it month-over-month or quarter-over-quarter.
Even small improvements (like a CES increase from 2.7 to 3.0) indicate meaningful enhancements to your customer experience.
4. Look Beyond the Numbers
Don’t just rely on your average score. Analyze CES data by specific interactions, support channels, and agents. Averages alone might hide issues like specific customer support agents who are struggling or a certain product causing confusion.
5. Take Action on the Insights
The goal of CES isn’t just measurement—it’s improvement. Use CES results to clearly identify areas of friction. Then, simplify processes, improve agent training, and make proactive changes to reduce customer frustration.
How to Improve Your Customer Effort Score
CES reveals where your customers face unnecessary challenges. Once you pinpoint these pain points, here’s how to address them directly:
1. Streamline Customer Interactions
Look at the entire customer journey and remove unnecessary steps. Are customers being passed between multiple agents or repeating their problems multiple times? Simplify these interactions.
2. Enhance Self-Service Options
Invest in intuitive, easy-to-use self-service tools like knowledge bases, FAQs, chatbots, or automated phone systems. Good self-service reduces effort and prevents unnecessary interactions with your support team.
3. Offer Solution-Oriented Training
Equip your customer service representatives with the tools, training, and scripts needed to solve problems quickly. Reducing back-and-forth interactions and eliminating confusion makes a big difference in CES scores.
4. Provide Omnichannel Support
Customers often switch channels when they encounter problems. Whether starting online, via chat, or phone, be sure interactions are consistent across every channel. Customers should never feel they’re starting over each time they reach out.
5. Reduce Response Times
Shortening hold times and quickly responding to emails and chats improve customer perception. High service efficiency makes interactions feel easy and reduces customer frustration.
6. Proactively Address Common Issues
Use CES feedback to identify recurring problems (billing confusion, delayed shipments, etc.). Then proactively communicate solutions before customers even notice or complain. This approach can significantly lower your CES.
7. Monitor & Measure Progress
After taking these steps, keep tracking CES. Continuously measure whether your actions translate to lower customer effort. Regular tracking uncovers improvements and highlights new areas to optimize.
Improving your CES means happier customers, fewer service costs, and higher loyalty. Next, let’s clearly distinguish how CES compares to other popular metrics—NPS and CSAT—and why you need all three for a complete CX picture.
Customer Effort Score vs. NPS & CSAT: What’s the Difference?
Customer Effort Score is powerful. But if you look at just one metric, it’s like using a pair of prescription glasses that have only one lens.
To get a full picture of your customer experience, pair CES with other core metrics like Net Promoter Score (NPS) and Customer Satisfaction Score (CSAT).
Each one tells you something different:
- CES shows how much effort the customer had to exert.
- NPS reveals how likely they are to recommend your brand.
- CSAT captures how satisfied they were with a specific interaction.
By combining them, you uncover customer insights that would otherwise go unnoticed.
5 Customer Effort Score Mistakes to Avoid
CES can mislead you if you’re not careful. Here are common mistakes to avoid, so your CES results stay accurate and actionable.
1. Poor Survey Timing
If your CES survey isn’t sent immediately after the right customer service touchpoint, customers may forget key details. Late surveys produce inaccurate data that won’t clearly reflect true customer effort.
Always send CES surveys promptly—right after each relevant interaction, while customers’ experiences are fresh.
2. Vague or Misleading Questions
Asking unclear or overly broad questions confuses customers. A vague CES question leads to vague responses, leaving you without actionable insights.
Use precise, straightforward questions like: “How easy was it to resolve your billing issue today?”
3. Over-Reliance on Numbers Alone
CES numbers highlight general friction points but rarely explain why friction exists. If you rely solely on numeric scores, you’ll miss essential details behind customer struggles.
Always include an open-ended question for comments. Customer comments provide context and deeper insight into why your CES scores are high or low.
4. Misinterpreting Results Without Context
A sudden spike in CES may seem alarming. But it could reflect temporary issues (e.g., a website outage) rather than systemic problems.
Always analyze CES data within context. Review external factors—like service outages, product changes, or training issues—that may influence scores.
5. Failing to Take Action
Collecting CES without acting on insights frustrates customers. Customers who repeatedly share feedback without seeing improvements become disillusioned and eventually churn.
Identify issues your CES reveals. Take visible, concrete actions. Communicate those improvements back to customers to build trust and loyalty.
Avoiding these pitfalls ensures your CES surveys produce accurate data and real business improvements.

Do More Than Simply Collect Data
Customer Effort Score is a powerful tool for real improvement. But it only works if you act on what your customers tell you.
Too many companies collect CES data only to let it gather dust. They miss the opportunity to reduce friction, simplify interactions, and improve customer service altogether.
Don’t make that mistake.
When customers share feedback, they expect improvement. Listen carefully to what they say. Identify exactly where they struggle and act decisively to simplify those interactions.
At Interaction Metrics, we believe measuring customer effort should always lead directly to real change. Every survey you send should deliver clear insights, actionable steps, and measurable results.
Don’t settle for generic, one-size-fits-all surveys that deliver vague results. Go deeper. Identify pain points. Remove friction. Then, communicate improvements back to your customers.
Discover A Better Way to Measure CES
At Interaction Metrics, we believe CES demands a more disciplined, thoughtful approach.
We’re a full-service survey firm with a scientific, rigorous approach to measuring customer effort.
Our TrueData model transforms CES from raw numbers into actionable insights that drive your business forward.
Here’s how the TrueData model works:
1. True-Facts: Scientifically Valid Surveys
Every CES survey is custom-built for your company. We use an exclusive 20-point bias checklist to eliminate leading questions or skewed data. That means you get genuinely accurate survey responses that reflect true customer effort.
2. True-Tech: World-Class Survey Software
We license top-tier software tools like Qualtrics, Alchemer, and SPSS. With us, you get enterprise-level data analysis without the hassle or expense of managing software yourself.
Our experts manage all survey creation, deployment, and analytics to free up your resources.
3. True-Insight: Actionable Analysis
CES numbers alone can’t drive improvements. That’s why we go deeper. We use techniques like text mining, correlation analysis, and cross-tabs to understand the full story behind your CES scores. So you receive clear, actionable recommendations to improve your customer interactions right away.
At Interaction Metrics, we move beyond CES measurement into genuine customer experience improvement.
We pinpoint exactly why your customers experience friction. Then we provide practical guidance to simplify customer service interactions, reduce frustration, and build lasting loyalty.
If you’re serious about lowering customer effort and improving your customer relationships, Interaction Metrics has the clear, rigorous approach you need. Let’s discuss your survey needs today.
FAQs About Customer Effort Score
What is the difference between CES, NPS, and CSAT?
CES (Customer Effort Score) measures how easy it is for a customer to complete an interaction. NPS (Net Promoter Score) measures loyalty and willingness to recommend. CSAT (Customer Satisfaction Score) measures how satisfied a customer feels after a specific interaction. Using all three gives you a complete view of the customer experience.
What is a good Customer Effort Score benchmark?
A good Customer Effort Score is typically 4 or higher on a 5-point scale. Higher scores mean customers experienced less friction. Scores below 4 may indicate areas that need improvement. Trends over time are more important than one specific number.
How often should I send a CES survey?
You should send a CES survey after key customer interactions. These include after a support call, product purchase, or using a self-service feature. Timely, event-based surveys deliver more accurate and actionable feedback.
What is the best CES question to ask?
The best CES question is: “How easy was it to resolve your issue today?” It’s simple, clear, and directly tied to the customer’s experience. It works well across support, billing, onboarding, and more.
Can CES predict customer behavior?
Yes, Customer Effort Score can predict customer behavior. High-effort experiences often lead to churn, while low-effort interactions increase long-term customer loyalty and repeat purchases. CES is one of the strongest predictors of future customer retention.
============================================
Care to discuss your next survey? Get in touch!
============================================
The post What Is Customer Effort Score (CES) & Why Does It Matter? appeared first on Interaction Metrics.
]]>Read more
The post 60+ Different Survey Types & Methods (and When to Use Them) appeared first on Interaction Metrics.
]]>A lot of businesses collect customer feedback—but do they turn it into real insight, or just a stack of random data?
An even bigger question: do they actually know which types of customer satisfaction surveys best match their goals?
When most people talk about “different survey types,” they focus on delivery formats: online surveys, phone surveys, mail surveys, or paper forms. That’s an important part of the picture, but if it’s all you look at, the picture is incomplete.
Survey research methods aren’t only about how you distribute your surveys.
They’re also meant to help you meet specific survey objectives and gain insight. Insight you can use to boost your brand reputation, improve customer sentiment, and drive customer success.
In this blog, we’ll explore the most widely used survey methods and designs before diving into the specific types of surveys you can use to achieve specific goals and improve the customer experience.
If you’re itching to start gathering better data (and put it to work), learn more about Interaction Metrics. We’re the leading customer survey company if you want to move beyond generic survey templates and steer your business decisions based on third-party, reliable data.
Let’s start with the basics.
Types of Survey Methods by Format
These are the most recognizable customer surveys—the physical or digital delivery methods you use to gather feedback.
If you’ve ever taken customer satisfaction surveys after speaking with customer service representatives or clicked a one-question poll on a website, you’ve interacted with one of these.
Here’s a breakdown of the most common survey formats and how they’re typically used.
- Online Surveys: Hosted on web platforms and sent via a survey link. Great for reaching large customer segments, but often ignored if not well-designed or personalized.
- Mobile & App-Based Surveys: Designed for smartphones or built directly into an app experience. Ideal for quick, on-the-go customer satisfaction feedback, especially after key actions (like a product purchase or feature use).
- Email Surveys: These are still popular for gathering detailed feedback, but response rates vary. Email surveys are most effective when tied to a specific event or personalized outreach.
- SMS/Text Message Surveys: SMS surveys are short and sweet, with high open rates. Perfect to measure customer satisfaction immediately after interactions—but not ideal for complex survey questions.
- Phone & Post-Call Surveys: These are live or automated calls that capture deeper insights. They’re often used right after a support call to gather feedback on how much effort it took to resolve an issue.
- Mail-In / Postal Surveys: These are used less frequently nowadays, but they’re still valuable for reaching an older target population or those less connected digitally (like healthcare or government services).
- Paper Surveys: These are similar to mail-in surveys, but distributed in person. They’re commonly used at events, workshops, or training sessions to capture feedback from survey respondents on-site.
- Kiosk Surveys: For these surveys, Kiosks are placed in physical stores or offices. Customers use them to quickly provide feedback before leaving, which lets you capture real-time customer sentiment.
- In-Person / Face-to-Face Interviews: These surveys offer the richest customer insights and highest data quality, but they’re resource-heavy. Great for qualitative research or major product and brand decisions.
- Intercept Surveys: These are quick in-person surveys that involve stopping shoppers in a mall to answer a few brief customer loyalty questions.
- Chat Surveys: Embedded in messaging tools or live chat systems to quickly collect customer feedback. Low friction, but depth of responses can be limited without thoughtful design.
- Pop-Up Surveys: These surveys are triggered by website behavior and ask existing customers about their satisfaction after they’ve spent time on certain pages.
- Embedded Surveys: These are surveys placed within content, like blog posts or help articles, to gather feedback right when the topic is fresh.
- QR Code Surveys: QR codes printed on receipts or physical signage let customers instantly provide customer feedback via mobile devices.
- Social Media Surveys: These involve sharing polls or survey links on social platforms to quickly gauge brand perception or customer sentiment, although results can vary in representativeness.
- Panel Surveys: These surveys are delivered long-term to groups that provide regular, consistent feedback. Ideal for measuring customer satisfaction trends and changes in customer sentiment over time.
- Focus Groups: These aren’t strictly for surveys, but are often grouped here. A facilitator leads small group discussions to explore deeper customer insights, uncover unmet needs, or test new ideas directly with your target audience.
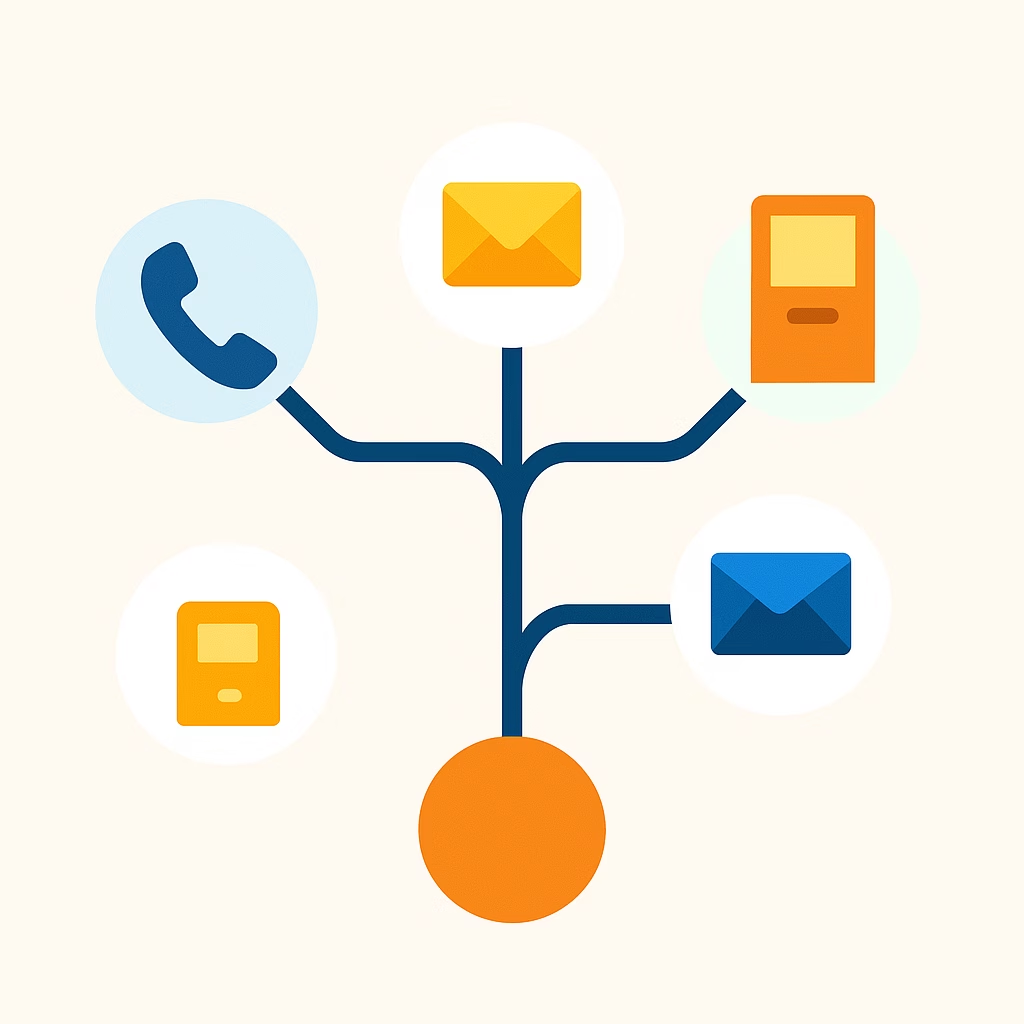
Different Types of Survey Design in Market Research
So far, we’ve talked about how surveys get delivered. Now let’s explore why certain surveys are created—and how that shapes the questions you ask, the people you target, and the insights you uncover.
Survey design is about intent just as much as it’s about delivery format.
Choosing the right survey design helps to be sure you get accurate data that actually informs your business decisions.
Here’s a closer look at the five key survey designs used in market research.
Exploratory Surveys
Exploratory surveys are used when you’re just starting to learn about a topic.
Maybe you’re entering a new market, trying to understand customer sentiment around a new idea, or you’re not yet sure what questions you should even ask.
These surveys are often open-ended, asking broad questions like:
- “What do you think about our product?”
- “What features do you wish we offered?”
They typically gather qualitative data that helps you form hypotheses, refine your product concepts, or identify customer segments. They’re usually sent to a smaller group—often early adopters or existing customers who have experience with your brand.
Example: Starbucks famously used open-ended feedback channels (like its “My Starbucks Idea” platform) to explore what flavors, store layouts, and mobile-order options people wanted. Those exploratory insights led to new drink offerings and better features included in the app.
Descriptive Surveys
Descriptive surveys aim to measure or quantify a specific aspect of your market or customer base.
Unlike exploratory surveys, they use structured questions (usually multiple-choice or scale-based) to gather quantifiable data from a broader audience.
These surveys help you answer questions like:
- “How satisfied are customers with our online ordering experience?”
- “What percentage of our users are willing to pay more for faster shipping?”
They produce reliable, actionable metrics and help measure customer satisfaction, market share, brand perception, and more.
Example: Amazon often runs descriptive surveys to track Prime member satisfaction, shipping preferences, and what influences repeat purchases. Quantifying these data points regularly lets the company refine offerings like Prime while improving delivery times and content services.
Causal Surveys
Causal surveys help uncover cause-and-effect relationships. They’re designed specifically to test whether a particular action or change leads directly to an observed result.
They’re often paired with controlled experiments or A/B tests. Questions focus on comparing scenarios or conditions, such as:
- “Does offering free returns increase customer loyalty?”
- “Did our new online checkout process reduce shopping cart abandonment?”
These surveys usually require careful planning and rigorous statistical analysis to ensure the results are valid.
Example: Netflix frequently tests interface changes with a subset of users, then surveys those users to see if the new interface led to higher engagement.
If engagement scores spike, Netflix rolls out the change more broadly.
Delphi Surveys
Delphi surveys gather structured input from a panel of experts, often over multiple rounds.
Each round refines the previous round’s findings until the panel reaches consensus or highlights points of disagreement.
They’re frequently used for complex decision-making processes, forecasting, or strategic planning. Delphi surveys are ideal when uncertainty is high and informed consensus matters.
Typical questions include:
- “What technological trends will most impact our industry in the next 5 years?”
- “Which public health interventions are likely to be most effective in a new disease outbreak?”
Example: The Cleveland Clinic has used Delphi methods to forecast emerging healthcare trends, tapping specialists across cardiology, oncology, and digital health. After several survey rounds, they pinpoint which innovations deserve priority funding.
AI-Driven Surveys
AI-driven surveys leverage artificial intelligence and machine learning to dynamically personalize survey experiences in real time. These surveys adapt to respondents’ answers, analyze responses immediately, and even generate follow-up questions based on previous answers.
They’re best when you need highly personalized insights or when you’re analyzing sentiment, tone, or nuance at scale.
Common use cases include:
- Capturing detailed customer feedback on complex services.
- Quickly identifying dissatisfaction signals during product launches.
Example: Slack has experimented with AI-driven surveys that gauge user sentiment around new features. If early feedback suggests confusion, the survey adapts to pinpoint exactly where users get stuck, which speeds up product improvements.
Customer Satisfaction, Experience, and Market Research Surveys by Use Case
Let’s get to what really matters: why you’re surveying in the first place.
Sure, you can send a text survey or a link in an email—but format means nothing if you’re not collecting insight that actually helps your company.
That’s why we’ve organized 40+ different survey types based on business goals and use cases below.
These are the surveys that, when designed well, lead to better customer relationships, smarter products, happier employees, and clearer market positioning.
")
Customer Experience & Feedback Surveys
These surveys cover every customer touchpoint—online, offline, or somewhere in between. From post-transaction forms to comprehensive loyalty studies, you’ll see how customers feel about the entire journey. You can use this data to improve customer satisfaction.
Customer Satisfaction Surveys (CSAT)
Creating customer satisfaction surveys involves asking the classic question: “How satisfied were you with your experience?” They’re easy to fill out and offer a clear metric—often called your customer satisfaction score—for spotting areas that need improvement. If you’re looking for customer satisfaction survey examples, consider how retailers ask about store cleanliness or how SaaS platforms check in on feature usability.
Net Promoter Score (NPS) Surveys
NPS surveys measure loyalty with one question: “Would you recommend us?” They work best when you include a follow-up to learn why some customers are enthusiastic and others are not.
Customer Effort Score (CES) Surveys
CES surveys ask, “How easy was that?” They highlight friction points, such as confusing checkout steps, so you can remove barriers and keep people coming back.
Customer Service Feedback Surveys
These surveys go out soon after a customer interacts with your support team. They reveal whether reps solved the problem effectively and help you discover areas for coaching.
Post-Transaction Surveys
Post-transaction surveys capture first impressions right after a purchase. Quick tweaks based on this fresh feedback can improve future checkouts or deliveries.
Onboarding / Welcome Experience Surveys
Sent early in the customer journey, these surveys identify initial pain points before they grow. A smooth onboarding keeps new customers interested and engaged.
Customer Loyalty Surveys
These go deeper than NPS by investigating what drives people to stick with your company. Knowing the “why” behind loyalty or churn guides better retention strategies.
Voice of Customer (VoC) Surveys
VoC surveys collect open-ended thoughts from customers on a broad scale. They often reveal hidden themes you’d never uncover through closed-ended questions alone.
Churn / Exit Surveys
When customers leave, these surveys show why. Honest feedback from departing customers is a goldmine for preventing future losses.
Customer Expectations Surveys
Expectations shape satisfaction. These surveys discover what buyers thought they’d get, so you can refine marketing promises or adjust features to match reality.
Touchpoint-Specific Surveys
These mini-check-ins occur at key moments, like a delivery or renewal. Tracking satisfaction across multiple touchpoints helps you fix issues and boost consistency.
Follow-Up Satisfaction Surveys
After you resolve an issue, these surveys confirm whether the solution actually worked. They’re crucial for making sure you haven’t overlooked anything.
Customer Satisfaction with Resolution Surveys
These focus specifically on how well a problem was fixed. Use them to see if the solution truly addressed the original complaint.
Renewal Decision Surveys
These surveys let you ask, “What do you still need?” Finding unmet needs can shape your next product update or even reveal new market opportunities.
Customer Needs Assessment Surveys
Ask customers what’s missing. Identifying unmet needs early lets you stay ahead of competitors—and gives customers the experience they didn’t know they wanted.
Customer Relationship Health Surveys
Sent periodically, these track how people feel about your brand over time. Early warning signs of dissatisfaction let you intervene before customers bail.
Delivery Experience Surveys
These surveys ask about shipping speed, package condition, or overall handoff. Even small improvements can make a big difference when you deliver products.
Checkout Experience Surveys
These brief forms ask about ease of payment, clarity of pricing, and other transaction details. If checkout frustrates shoppers, you can fix the problem fast.
Subscription Experience Surveys
Check in with subscribers to learn about usability, perceived value, and any annoyances. Keeping a finger on the pulse of subscribers helps you reduce churn.
Technical Support Feedback Surveys
Technical issues can be complicated. These surveys confirm whether your support team explained the fix well and resolved the core problem.
Return / Refund Process Surveys
Returns matter to buyers. These surveys highlight how well your return policy works from the customer’s point of view, which helps you refine it and rebuild trust.
Digital Experience Surveys
Here, we focus specifically on digital interactions, like navigating your website, using your mobile app, or responding to emails.
If your customers primarily engage with you online, these surveys zero in on the unique challenges of digital environments. You can use insights from these surveys to reduce friction and make the purchase experience as simple as possible.
")
Website Experience Surveys
Your website is often your first impression. Website experience surveys ask about navigation clarity, content relevance, page speed, and ease of finding information.
These insights show you where visitors get confused or frustrated so you can streamline paths to purchase, increase conversions, and reduce bounce rates.
Mobile Application Experience Surveys
Mobile apps should feel intuitive and seamless. App experience surveys capture feedback on bugs, feature usability, design clarity, and overall user satisfaction.
Acting on this feedback boosts engagement, increases retention, and helps you measure how much value your app delivers to users.
Content Usefulness Surveys
These quick surveys typically ask readers, “Was this helpful?” after they engage with blog posts, FAQs, or help articles.
Gathering this direct feedback helps you understand exactly what content resonates, what’s missing, and how you can improve clarity. Ultimately, these surveys help you create content that genuinely helps your audience.
Newsletter / Marketing Preference Surveys
Email fatigue is real. Preference surveys make sure your newsletters and emails land with the right audience at the right frequency. They enable you to tailor content type, frequency, and tone based on subscriber preferences. The result is reduced unsubscribes and spam complaints—and often, boosted engagement and open rates.
Product & Innovation Surveys
If you’re launching something new—or improving what’s already out there—Product & Innovation Surveys keep you aligned with what your customers actually need.
They help you avoid expensive mistakes (like investing in a feature nobody wants), identify exactly what to build next, and confirm whether your product truly solves real customer problems.
")
Product Feedback Surveys
After customers have used your product, these surveys capture reactions about quality, satisfaction, feature gaps, and pricing. Understanding real user experiences helps you quickly fix problems, refine features, and keep your product relevant and competitive over time.
Concept Testing Surveys
Thinking of launching something new? These surveys test your idea before it hits the market. They confirm whether your concept addresses real customer needs—or just seems good in theory.
Early validation saves money, reduces risk, and helps you confidently build products customers actually want.
Feature Prioritization Surveys
What should you build next? These surveys ask customers to rank or prioritize potential features.
When you can see what truly matters to your users, you can focus your resources where they’ll lead to happier customers and faster growth.
Usability Testing Surveys
These surveys gather insights after users have tested your product hands-on. They uncover what’s intuitive, what feels confusing, and where users get stuck. You can use this feedback to create smoother experiences, reduce frustration, and boost product adoption.
Innovation Readiness Surveys
Not every audience is ready for every innovation. These surveys measure how receptive customers are to new ideas or technologies. Understanding innovation readiness helps you target early adopters first, tailor your marketing message, and smoothly introduce groundbreaking changes without alienating core users.
Employee Experience & Culture Surveys
Your team is the backbone of your business. Investing in their satisfaction builds a culture of excellence that benefits both the company and its customers.
These surveys reveal how staff members feel about the jobs they perform, where they see gaps in training, and whether there’s a disconnect between how they think they’re serving customers and how customers actually perceive that service.
When you understand these nuances, you can align employee actions with customer needs and build a workplace where everyone thrives.
")
Employee Satisfaction Surveys
These surveys check in at every stage of employment, from recruitment through exit. Regular feedback helps spot patterns, fix systemic issues early, and ensures your people feel heard. When you act on their feedback, you can boost retention, engagement, and morale along the way.
Employee Engagement Surveys
Are team members just going through the motions, or do they genuinely care about delivering great service? Engagement surveys reveal how employees feel about their roles—and how that impacts their interactions with customers. Higher employee engagement typically means more positive experiences, less turnover, and a culture of genuine care.
Manager Feedback Surveys
Good managers shape great teams. These surveys give employees a safe, confidential way to provide feedback on leadership. Managers get actionable insights to improve their style, and employees feel empowered knowing their voice matters.
Onboarding Experience Surveys (Employee)
The first weeks on the job set the tone for an employee’s entire journey with your company. These surveys reveal if your onboarding process clearly communicates expectations, builds confidence, and helps new hires succeed quickly.
Exit Interviews / Surveys
Finding out why employees leave is a great way to prevent future turnover. Exit surveys identify patterns and highlight hidden problems before they become bigger issues, making your workplace stronger and more attractive to current and future employees.
DEI (Diversity, Equity, Inclusion) Surveys
Is your workplace truly inclusive? DEI surveys capture honest employee perspectives on fairness, inclusion, and belonging.
Organizational Communication Feedback Surveys
Do your employees understand the “big picture” of your company? These surveys evaluate clarity, timeliness, and effectiveness of internal messaging. Better communication means less confusion, higher morale, and stronger alignment across teams.
Workplace Safety Perception Surveys
These surveys are critical for industries where safety matters most—manufacturing, healthcare, construction, and beyond. Safety perception surveys reveal gaps between perceived and actual safety practices. You can act on feedback to protect employees and reduce the likelihood of accidents in the workplace.
Training & Development Feedback Surveys
Do your employees feel well-equipped to succeed? These surveys check whether training is relevant, effective, and practical. Improving training based on feedback helps employees grow, feel supported, and boosts overall team capability.
Team Collaboration & Culture Surveys
Teamwork makes or breaks company culture. These surveys uncover how teams are working together—and what gets in their way. With these surveys, you can spot friction, foster better collaboration, and build a healthier workplace culture where employees enjoy showing up each day.
Brand & Market Understanding Surveys
A brand isn’t defined by your marketing copy. It’s defined by how your audience actually feels about you—whether they trust your reputation, believe in your products, or see you as an industry leader.
These surveys move beyond “Do people like our brand?” and dig into how brand perception impacts real-world decisions, like repeat purchases and word-of-mouth recommendations. Use them to understand and enhance your competitive position in the market.
")
Brand Perception Surveys
Do customers see you as trustworthy, innovative, affordable, or maybe overpriced? These surveys clarify exactly how your audience views your brand.
With these insights, you can sharpen your positioning, craft messaging that resonates with your audience’s desires, and create a brand perception that aligns with your goals.
Market Research Surveys
Want to stay ahead of competitors and industry trends? Market research surveys reveal valuable insights about your market, from pricing expectations and competitor benchmarks to emerging demands for new features. This keeps your products competitive, your pricing smart, and your decisions market-informed.
Pre/Post-Event Feedback Surveys
If hosting an event or webinar, these surveys capture attendee expectations beforehand and reactions afterward. Understanding what went right (or wrong) ensures every future event is smoother, more engaging, and more valuable for participants.
Advocacy Willingness Surveys
Advocacy surveys identify your biggest fans and clarify exactly why they’re enthusiastic. They reveal which customers are eager to recommend you—and who needs a nudge. Knowing this helps you replicate successful experiences and turn satisfied customers into active promoters.
Referral Interest Surveys
Referrals can drive growth, but only if customers actually want to refer you. These surveys gauge referral willingness and test incentives that would encourage more customers to share your brand. You can use insights from these surveys to build referral programs that actually work.
How to Choose the Right Survey Type for Actionable Survey Data
Knowing the different types of survey methods is one thing. Choosing the right one for your specific situation? That’s where most businesses get stuck.
Here’s how to make that decision easier—and more effective.

Start With the End in Mind
One of the biggest reasons surveys fail is that they lack a clear purpose. Before you send a single question, define your main objective and how you’ll use the results to drive real decisions.
Ask yourself:
- What do I need to know after this survey?
- What decision will this data help me make?
- Who am I surveying—and what’s the best way to reach them?
When you focus on the outcome, the right method becomes a lot clearer.
Consider the Audience
Many surveys flop because they’re not tailored to the people actually taking them.
Busy professionals may only have a moment for a quick poll, while your longtime loyal customers could be willing to share detailed feedback if prompted.
Adapting to each group’s needs and preferences can boost response rates and help you gather more useful insights.
If you want a head start, customer satisfaction survey templates can be adapted to fit your brand and objectives, but always make sure to customize them for your specific audience.
- Busy professionals? Keep it short and mobile-friendly.
- Longtime customers? Ask deeper questions—they’ll have more to say.
- Technical users? Be precise. No fluff.
Match Method to Moment
Don’t forget: quality almost always beats quantity.
You don’t need ten surveys to get good insight. You need one well-timed, well-written survey with questions that actually matter—and a plan to do something with the results.
Some quick pairings:
- Need fast, low-effort feedback after a purchase? → Go with SMS or Post-Transaction Surveys
- Looking for early input on a new product? → Use Concept Testing or Exploratory Surveys
- Trying to boost retention in a subscription model? → Deploy Churn, Renewal, or Customer Needs Assessment Surveys
- Want to improve internal culture? → Start with Employee Experience and Engagement Surveys
Design Your Next Survey With Interaction Metrics
If your survey program is even slightly off, you’ll miss issues that cost you customers. Surveys aren’t just a way to gather data; they also shape how customers perceive your company.
If they feel spammy or ask the wrong questions, customers will ignore them—or worse, stop doing business with you altogether.
As a top-tier customer survey company, we know that the real point of a survey is to collect high-quality data resulting in actionable analysis.
That’s why we developed TrueData—a system that prevents the pitfalls of bias, poor design, and dead-end analysis.
Instead of just automating more surveys, we combine scientific rigor, smart technology, and actionable insights to ensure every survey truly benefits your business.
Here’s what every survey should deliver under TrueData.
True-Facts: Proven Surveys
Get unbiased, scientifically valid feedback that aligns with your goals.
We customize every survey to your needs—be it NPS, open-ended feedback, or specialized metrics.
Our 20-point bias checklist removes skew and ensures you hear exactly what your customers feel and think.
By eliminating survey spam and unhelpful questions, we help you uncover the loyalty drivers and blind spots that most programs miss.
True-Tech: Turnkey Technology
Access all the premium platforms with zero technical headaches.
We already have licenses for Qualtrics, CRM integrations, PowerBI, SPSS, and more. You never pay extra for software, which means you save more money.
Our end-to-end campaign management ensures you send surveys at the right times, with the right tone.
Because we handle everything—from design and deployment to data visualization—your team stays focused on acting on results, not tech troubles.
True-Insight: Actionable Analysis
Understand metrics and correlations that drive growth. Forget dashboards that do nothing but gather dust.
We blend cross-tabs, correlation analysis, and text mining to reveal what truly influences customer loyalty.
You can choose from proven metrics like Net Promoter Score, Proactivity Score, Customer Effort, or a custom blend that fits your brand.
By surfacing root causes and hidden opportunities, we make it clear where to invest next for the biggest impact.
The bottom line is this: Surveys are an extension of your customer experience. When they’re poorly designed, you get worthless data and alienated customers.
With TrueData, your surveys are designed correctly every time. You gain the insights you need to grow your business and nurture lasting loyalty.
Ready to get started? Let’s make sure your surveys actually serve your business. Contact Interaction Metrics to learn how TrueData can transform your feedback into results.
============================================
Care to discuss your next survey? Get in touch!
============================================
The post 60+ Different Survey Types & Methods (and When to Use Them) appeared first on Interaction Metrics.
]]>Read more
The post The Best CX Software Of 2025 appeared first on Interaction Metrics.
]]>Just as customer satisfaction surveys reveal gaps in happiness, the right customer experience software bridges them; It helps you meet customers where they are and deliver personalized support every step of the way.
Today’s rising CX demands mean AI, omnichannel engagement, and deep personalization are no longer “nice-to-have” in your customer data platform—they’re essential features that any software worth its salt will include.
But even the flashiest software fails if it drowns you in meaningless data or frustrates customers with yet spammy survey invitations from do-not-reply addresses.
That’s why at Interaction Metrics, we help companies cut through the noise and make meaningful improvements in the customer experience. We reject the industry’s obsession with survey spam and vanity metrics—and instead champion CX tools that:
- Respect customers’ time
- Turn feedback into dialogue
- Analyze data with scientific rigor
We’ve seen firsthand how selecting the best customer experience management platform for your company’s needs can transform brand loyalty, reduce support costs, and build long-term customer trust.
In this guide, we’ll walk you through our favorite customer experience platforms that deliver on these promises in 2025 so you can boost loyalty, and build trust.
What Is CX Software?
Many people think of customer experience (CX) software as just another dashboard portal that lets you view customer experience data. But really, it’s the engine that drives improvements in the customer experience.
By analyzing feedback across every channel—surveys, social media rants, support calls, and even subtle shifts in app behavior—you can use CX software to uncover what customers really want.
Think of great CX software as a truth-teller: it lets you spot friction in real time, personalize interactions, and turn existing customers into die-hard fans.
Sounds like a CRM, right? Close, but not quite.
- CRM (customer relationship management): Primarily focuses on managing customer experience from a sales or support angle—tracking leads, storing customer data, and logging customer communication for future reference.
- CX software: Digs deeper into analyzing customer feedback, pinpointing customer pain points, and orchestrating improvements across all channels—not just at the lead or deal stage. It’s more about optimizing experiences and customer loyalty than organizing contact info and sales pipelines.
In short, the best CX platforms do more than simply report problems—they solve them.
They arm teams with AI-driven insights, automate fixes for common hiccups, and map journeys so seamlessly, that customers forget that the experience is being managed.
That’s why we didn’t just list “the most popular” tools in this article. We hunted for platforms that turn feedback into action and scale with your business.
Why Would You Need CX Software?
Not every company needs customer experience software.
If you have a CX team and are going to be running your own customer surveys, then you’ll want to choose the best software. Keep reading and see our top picks in the list below.
If you don’t have a team focused on customer experience, or you’re not looking to run your own surveys, then customer experience software probably isn’t the answer—instead, consider hiring a customer survey company.
A good customer survey company will be able to:
- Design surveys that get the insights you need
- Already have the best customer experience software—so you don’t need to buy it
That’s where we come in. At Interaction Metrics, we already have the best CX software—and we know how to use it. We have decades of experience in designing surveys to get the information you need, then interpreting the data so that you can take action to improve the customer experience easily.
How We Picked
In order to make the cut, each piece of software on the list needed to include at least 3 out of 5 of the following features:
- Omnichannel listening: Beyond collecting customer feedback from surveys, the best software lets you track every interaction, from heated support calls to subtle shifts in customer behavior on your app. If feedback exists, these tools capture it, turning whispers and shouts alike into actionable insights.
- AI that thinks like your team: We prioritized software that uses AI to spot patterns humans might miss, so you can easily glean insights that might otherwise go overlooked.
- Closed-loop systems: The best customer experience management software lets teams assign tasks, automate follow-ups, and resolve customer inquiries fast. No more “Oops, we missed that email!”—just smoother resolutions and happier customers.
- Journey mapping: We favored tools that visualize every step of the customer experience, from first-click excitement to post-purchase hiccups.
- Scalability and security: Whether you’re a startup or a Fortune 500, your software should grow with you. So we looked for software with data encryption and role-based access capabilities.
We scoured the web for dedicated CX tools that make customer feedback management efficient, insightful, and above all, impactful.
Without further ado, here are our top picks for Customer Experience Management Software in 2025.
Winner: Medallia
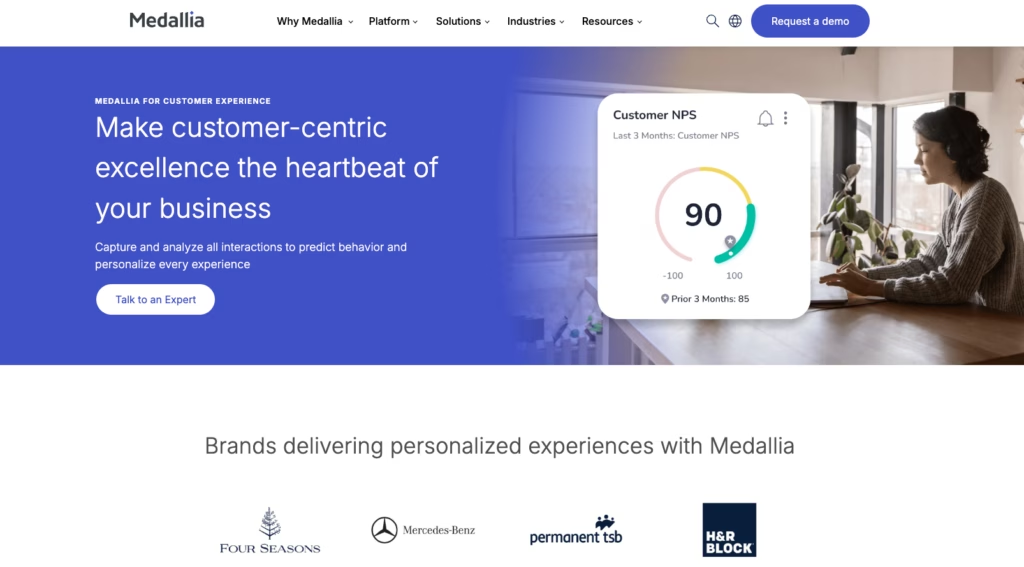
Medallia sits at the forefront of all-in-one enterprise CX because it unifies just about every feedback channel—surveys, social, web, video, call centers, text analytics—into a single, comprehensive platform.
Its AI-powered analytics can handle billions of signals (2 billion conversations analyzed and counting) and support millions of frontline users across 100+ countries. This level of scale makes it invaluable for large enterprises that need to rapidly sift through massive data streams.
At its core, Medallia focuses on real-time insights that reveal overarching sentiment and pinpoint specific touchpoints influencing NPS, CSAT, or loyalty. Notably, it captures video feedback for richer emotional insight—an extra edge in understanding the “why” behind survey scores.
The platform even analyzes employee feedback to tackle service gaps and drive cultural changes that improve both frontline retention and customer satisfaction.
What really sets Medallia apart is its closed-loop action management: real-time alerts, automatic case creation, and intuitive dashboards ensure that no issue slips through the cracks.
Leaders can see exactly where friction points exist, assign owners, and track resolution across thousands of stores or regions.
All these factors make Medallia the strongest end-to-end CX solution on the market—if you have the budget and resources to implement it fully.
Pricing
Medallia uses a complex pricing structure that includes an EDR-based model, where costs depend on the number of data records you process; for specifics and a custom quote, contact Medallia.
Runner Up: Qualtrics XM
Qualtrics XM is a power tool for measuring all your customer, employee, and market touchpoints across over 20,000 global brands in 100+ countries.
Founded in 2002 (and famously acquired, then re-acquired, in multi-billion-dollar deals), Qualtrics has analyzed billions of conversations and supports 3 million frontline users, showcasing how it scales to meet enterprise-level needs.
Its AI-driven insights and broad feature set—including dedicated suites for customer experience, employee engagement, and advanced market research—give large organizations the real-time data to make big decisions fast.
If you have complex feedback channels, want a single, scalable hub for surveys and analytics, and have the budget to match, Qualtrics XM delivers. Just be aware of the steep learning curve that accompanies such a robust platform.
Pricing
Full XM solutions require custom quotes—to learn more, contact Qualtrics for exact pricing.
Honorable Mentions
While these platforms didn’t snag our top spots, they’re far from benchwarmers. Each excels in niche areas—think razor-sharp social listening, hyper-scalable contact centers, or AI that predicts customer needs before they’re spoken.
They might lack the end-to-end polish of our winners or cater to narrower use cases, but if your priorities align with their superpowers, they’re worth a closer look.
Genesys Cloud CX
Genesys Cloud CX is a contact center workhorse built for mid-sized organizations that need a powerful, AI-infused solution.
With over 7,500 customers in 100+ countries, it unifies voice, email, chat, text, and social under one roof.
The platform continuously innovates, rolling out 400+ new features annually, and even offers AI Experience tokens so you can add AI-driven capabilities without extra infrastructure.
If you’re juggling multiple channels and need advanced routing plus workforce management, Genesys Cloud CX is a strong contender that easily scales with your team.
Pricing
Plans start at $75/user/month for the basics (voice, IVR, AI), rising to $155/user/month for advanced AI and workforce engagement. For a full quote, contact Genesys directly.
Sprinklr
Sprinklr is a unifying force for social, chat, email, and SMS interactions.
With AI annotation refined over five years, Sprinklr can handle 23 social channels and 11 messaging channels. This makes it ideal for maintaining brand consistency, providing 24/7 customer care, and launching effective social marketing campaigns at scale.
If you need an integrated approach to marketing, service, and insights complete with dedicated product suites (Service, Social, Insights, and Marketing), Sprinklr is your everything-in-one-place solution.
Pricing
Sprinklr typically provides custom, enterprise-focused quotes; prices can start high, so contact Sprinklr for a tailored plan if you’re ready to invest in centralized CX management.
NICE CXone
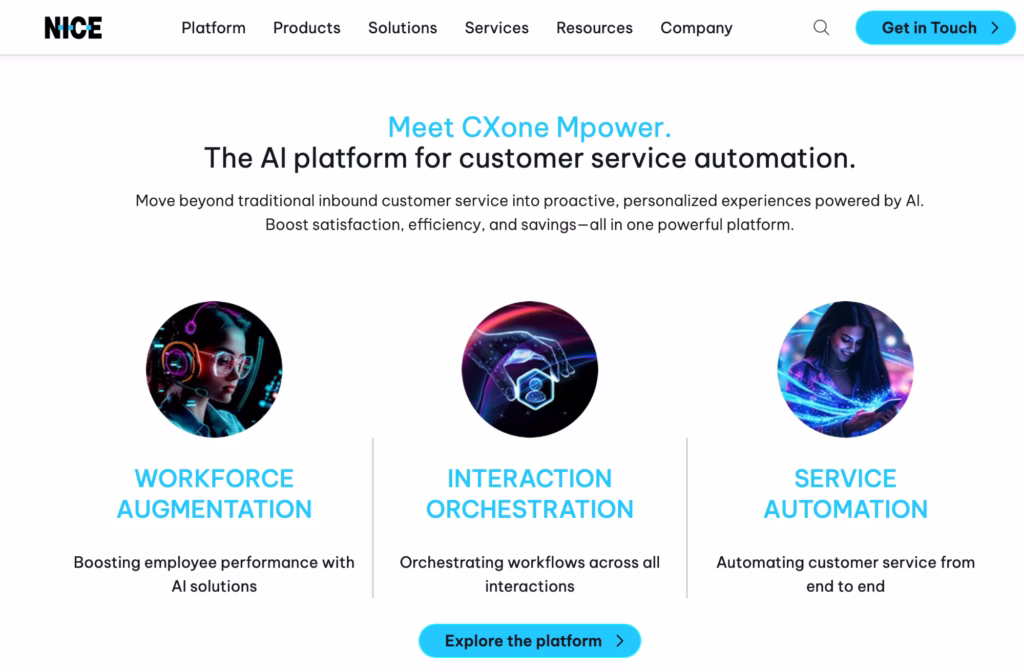
NICE CXone is a cloud-based contact center solution that merges voice, email, chat, and social channels under one AI-driven umbrella, trusted by 25,000+ organizations (including 85 of the Fortune 100) across 150 countries.
NICE CXone uses Enlighten AI to automate routine tasks, predict customer needs, and give agents real-time guidance to agents.
If your contact center requires omnichannel coverage, built-in workforce management, and advanced security (GDPR, HIPAA, PCI DSS), NICE CXone stands out as a scalable choice for handling high volumes of interactions.
Pricing
Plans generally start around $71/user/month and can reach $209/user/month based on usage and features. Contact NICE to get a custom quote for your exact needs.
InMoment
InMoment transforms unstructured, multi-channel feedback into quick, actionable insights, that slash ROI timelines down to about half the industry norm.
Trusted by 1,000+ global brands (including Foot Locker and Jack in the Box), it uses an in-house LLM to unify surveys, social media, call logs, email, and chat transcripts in one place.
If you’re wrangling multi-channel feedback and need AI-driven analysis to highlight high-priority issues, InMoment is a prime option for mid-sized to large enterprises aiming for rapid, data-driven CX transformations.
Pricing
InMoment’s rates are customized for each organization’s data volume and features. Contact InMoment to schedule a demo and get a tailored quote.
Forsta (Formerly Confirmit + FocusVision)
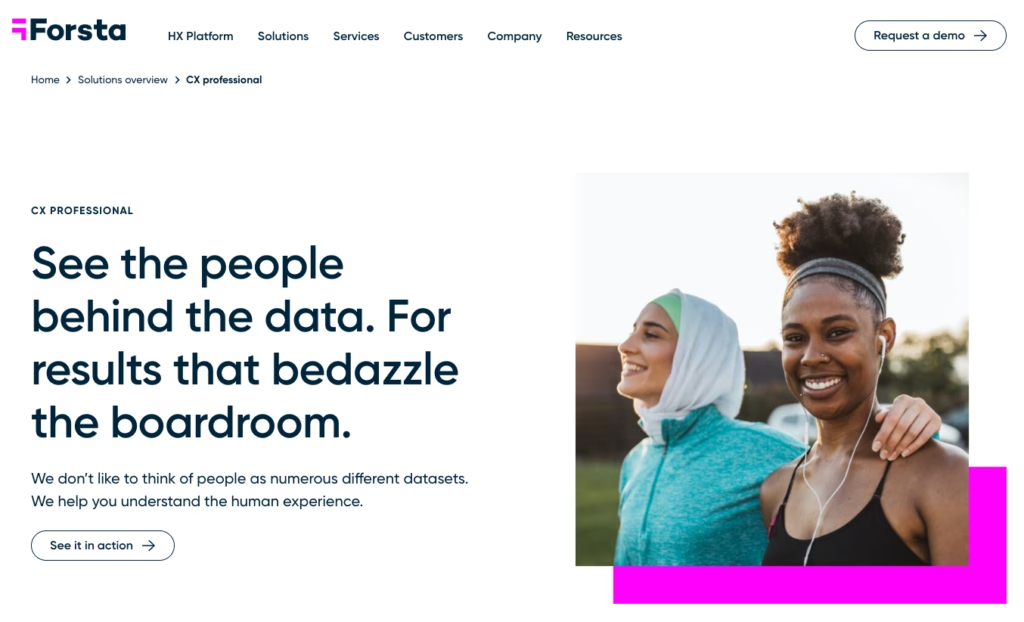
Forsta (formed after the merger of Confirmit and FocusVision) helps global brands like eBay unify customer feedback data from surveys, video interviews, and social media.
Its AI spots trends quickly and efficiently, and can reduce manual work by 75%. Teams can use predictive alerts to fix issues before they escalate and dashboards that sync with enterprise tools like Salesforce.
Forsta is ideal for companies that need guidance. They have a dedicated team that helps design surveys and strategies. Recognized as a leader by Gartner, it’s built for complex, global operations.
Pricing
Contact Forsta directly for custom pricing based on your business needs. Learn more at the Forsta website.
Alida
Alida focuses on turning customer conversations into actionable insights. Brands like Foot Locker use its Active Listening® tool to gather 2.4x more feedback via chatbots and social media.
The platform’s AI automates analysis, which frees teams to focus on implementing high-impact fixes. Real-time dashboards highlight urgent issues while community-building tools foster loyalty.
Alida is praised for fast results, with clients often reporting positive ROI in 12 months or less.
Pricing
Contact Alida for custom pricing tailored to your business. Learn more at Alida’s website.
Verint Experience Cloud
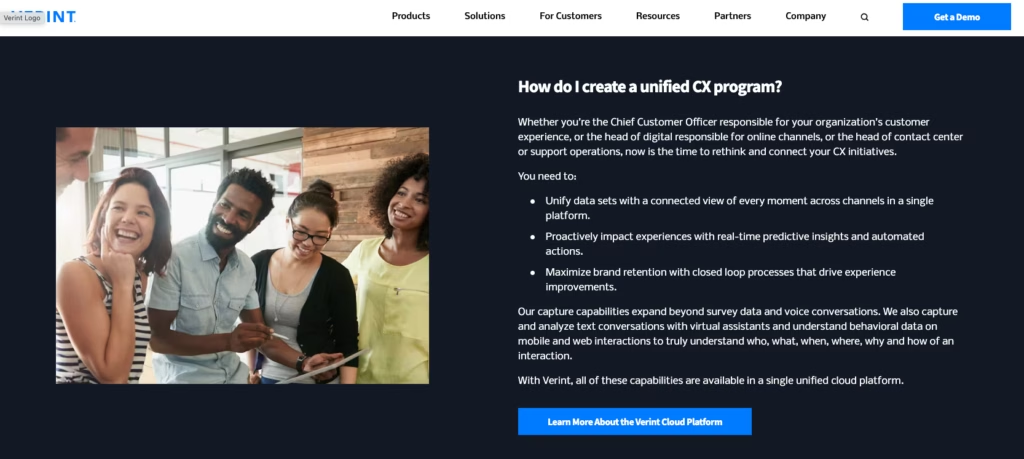
Verint helps regulated industries like healthcare and finance unify customer data from calls, chats, surveys, and apps.
It bridges older on-premises systems with modern cloud tools, which makes it ideal for organizations transitioning gradually to the cloud.
The platform’s AI automates 40% of repetitive tasks (like call transcriptions), so agents can focus on resolving issues. It also includes predictive analytics that spots customers at risk of leaving and identifies upsell opportunities.
Verint meets strict compliance standards (GDPR, HIPAA) and scales for large enterprises. Recognized as a leader by IDC, it’s trusted by Fortune 100 companies for secure, flexible CX transformation.
Pricing
Custom plans for hybrid cloud and compliance needs. Learn more about Verint and their solutions on their website.
Cisco Webex Experience Manager
Cisco Webex Experience Manager (formerly CloudCherry) is a hybrid CX platform that bridges on-premises systems and cloud-based AI, built for enterprises entrenched in Cisco’s ecosystem (e.g., Webex Contact Center).
It integrates inline post-call surveys, voice-of-customer analytics, and collaboration tools to unify data from 30+ channels.
Its hybrid model lets businesses in regulated industries retain legacy infrastructure while deploying AI-driven sentiment tracking. This reduces the need for manual analysis by 60% and in some cases, can boost NPS scores by 10+ points in as little as 6 months.
Features include GDPR/HIPAA-compliant dashboards, predictive employee experience analytics, and Cisco Security integrations for threat detection.
Recognized for 12-month ROI and seamless scalability, it’s ideal for mid-to-large firms prioritizing compliance without sacrificing real-time CX agility.
Pricing
Cisco provides a free tier, multiple paid tiers, and custom enterprise pricing based on hybrid deployment needs and user licenses. Explore options at Cisco’s website.
Oracle CX Cloud
Oracle CX Cloud is a unified CX suite that merges sales, marketing, service, and commerce data for enterprises in Oracle’s ecosystem.
It uses AI-driven personalization to analyze 50+ interaction types and predict churn risks with 92% accuracy, and claims to be capable of boosting conversions by 20% via real-time offers.
Features like Experience Data Records (EDR) pricing, predictive employee engagement analytics, and pre-built integrations for Salesforce/SAP let global brands unify siloed data into GDPR/CCPA-compliant workflows.
Recognized for 20% faster campaign ROI and 15% lower customer attrition, it’s built for complex enterprises needing seamless Oracle Fusion integrations, not SMBs.
Pricing
Oracle offers usage-based pricing tied to EDRs (Experience Data Records). Contact Oracle for a custom quote based on data volume and modules.
Emplifi
Emplifi (formerly Khoros) unifies marketing, commerce, and customer care into a single AI-driven platform trusted by Delta Air Lines, Ford, and 7,000+ other global brands.
Unlike siloed tools, it combines social media management, AI chatbots, and personalized commerce tracking to map customer journeys from ad engagement to post-purchase support.
Features like sentiment-based theme detection and predictive churn scoring boost retention by 25%, while GDPR/HIPAA-compliant dashboards centralize data from 50+ channels.
Notable for its empathy-driven analytics, Emplifi identifies emotional pain points in feedback so you can refine campaigns in real-time.
Ranked #1 in G2’s Social Suites category, it’s built for enterprises needing to scale CX without fragmenting teams.
Pricing
Emplifi uses custom pricing based on Experience Data Records (EDRs). Contact the Emplifi team for a quote tailored to your social, commerce, and care needs.
Calabrio
Calabrio merges workforce optimization (WFO) and CX tools in one platform, boosting agent performance with scheduling, coaching, and AI-driven insights.
It’s ideal for contact centers that want total transparency in terms of agent performance and customer satisfaction. If you need a single system for forecasting, recording, and analytics, Calabrio stands out.
Pricing
Calabrio offers custom pricing based on agent count and interaction volume.
Upland Rant & Rave
Upland Rant & Rave is a real-time CX platform specializing in emotion-driven insights for retail, finance, and utilities.
Unlike traditional survey-focused platforms, its NLP-powered sentiment engine includes sentiment analysis capable of decoding frustration, delight, or indifference in feedback from SMS, in-store kiosks, and 20+ channels.
Key for frontline teams, Rant & Rave turns employees into CX champions with gamified feedback dashboards that reward staff for resolving issues flagged by AI-driven alerts (e.g., angry social media comments).
Features like automated recovery workflows slash response times by 50%, while Voice of the Employee tools tie internal morale to customer satisfaction.
Built for FTSE-level scalability, it integrates with BlueVenn and CRMs to balance GDPR compliance with actionable empathy.
Pricing
Upland Rant & Rave offers custom pricing based on feedback volume and users.
ConcentrixCX
ConcentrixCX is a voice of the customer (VoC) platform capturing feedback from email, web, chat, and video.
It uses AI to surface sentiment, predict needs, and empower mid-sized to large enterprises to deliver end-to-end exceptional experiences.
Got a global footprint or high customer volumes? ConcentrixCX may be exactly what you’re looking for. It provides a single system that unifies data from multiple sources.
Pricing
Concentrix offers custom enterprise pricing based on interaction volume and AI features. Request a quote at ConcentrixCX.com.
OpenText Experience Cloud
OpenText Experience Cloud is an enterprise CX suite blending content management, AI-driven personalization, and composable architecture for industries like public services, utilities, and communications.
Its modular design lets global brands like Siemens and government agencies reassemble digital experiences on the fly by integrating web content, digital assets, and customer data into GDPR/HIPAA-compliant workflows.
Notable for industry-specific agility, it powers public sector digital services and telecom CX hubs, using predictive analytics to slash response times by 30%.
Pricing
OpenText offers custom pricing based on modules, users, and data volume.
Talkdesk CX Cloud
Talkdesk CX Cloud weaves together AI-based contact center tools, workforce management, and real-time analytics.
Designed for regulated industries, it offers GDPR/HIPAA-compliant workflows, Industry Experience Clouds (financial, healthcare, retail), and a Workspace Desktop App to unify 20+ channels into a single agent interface.
Talkdesk excels for enterprises modernizing CX with predictive analytics, low-code customization, and scalability supporting millions of daily interactions.
Pricing
Starts at $85 per user, per month. Scales to $225+ per user, per month for industry-specific tiers. Explore plans at Talkdesk’s pricing page or try a 14-day free trial.
Five9 Intelligent Cloud Contact Center
Five9 merges AI, omnichannel customer engagement, and analytics to unify every customer touchpoint.
Aimed at mid-sized to large enterprises looking for robust contact center capabilities, Five9 stands out for its Intelligent Virtual Agents (IVAs) that automate routine inquiries and real-time AI coaching that boosts agent performance.
Tailored for regulated sectors, it offers HIPAA/GDPR-compliant workflows, financial services-grade security, and industry-specific editions (healthcare, retail) with pre-built CRM integrations.
Pricing
Pricing starts at $119 per month for the most basic plan, with custom pricing available for enterprise packages. Learn more about Five9’s pricing here.
AskNicely
AskNicely is a frontline-first CX platform trusted by 1,300+ service businesses.
Recognized as the #1 solution for service industries on G2, it uses AI-powered micro-surveys (delivered via SMS, email, or in-app) and gamified leaderboards to keep teams engaged in real-time.
With SOC2/GDPR compliance, Slack and Zapier integrations, and automated review generation, AskNicely empowers franchises, healthcare providers, and field services to scale feedback loops so frontline workers can make sense of customer insights and address their needs on the spot.
Pricing
AskNicely starts at $449/month for core features. Explore plans at AskNicely’s pricing page or request a demo to tailor your plan to your team size.
Avaya OneCloud
Avaya OneCloud is a cloud-based CX suite that fuses communication, collaboration, and experience tools into one AI-powered platform.
Designed for mid-sized to large enterprises handling high interaction volumes or distributed teams, it unifies both CX and EX under one umbrella.
Coupled with predictive insights and flexible deployment, it’s perfect for modernizing communication infrastructure and optimizing the customer experience.
Pricing
Avaya offers custom quotes based on users, modules, and deployment models—explore options at Avaya’s website or contact sales to learn more about tailored UCaaS/CCaaS bundles.
Chattermill
Chattermill is an AI-driven CX analytics platform trusted by Amazon, Uber, and HelloFresh to decode unstructured feedback from 50+ sources into actionable insights.
Using deep learning models, it auto-tags themes, predicts churn risks, and prioritizes issues impacting NPS/CSAT, helping enterprises like HelloFresh achieve 300%+ ROI.
Features include real-time sentiment alerts, Qualtrics integrations, and dashboards that analyze billions of interactions to pinpoint CX gaps.
Pricing
Chattermill offers custom enterprise pricing. Visit their pricing page to learn more about what’s included with available plans.
SANDSIV
SANDSIV consolidates feedback from surveys, tickets, social, and more into an AI-driven platform that highlights sentiment trends in real-time.
Its proprietary NLP engine identifies high-impact pain points (e.g., shipping delays, product defects) and auto-prioritizes them by NPS/CSAT impact.
The result is that you can reduce the time it takes to perform a root-cause analysis by 50%.
Trusted by telecom and retail giants, SANDSIV offers GDPR-compliant dashboards, predictive churn models, and seamless SAP/Salesforce integrations to align CX insights with operational workflows.
Pricing
SANDSIV provides custom enterprise pricing. Learn more on the SANDSIV website.
SogoCX
SogoCX, part of the Sogolytics suite, is an omnichannel feedback platform that unifies surveys, support tickets, and social media data into AI-driven dashboards.
Designed to help mid-sized enterprises exceed customer expectations, it identifies urgent CX issues with real-time sentiment alerts. It also pinpoints top drivers of NPS/CSAT scores so your service teams know where to focus on improving service quality.
Features include QR code feedback collection for in-person interactions, HIPAA/GDPR-compliant analytics, and seamless CRM integrations (Salesforce, HubSpot) to align insights with frontline workflows.
Pricing
SogoCX offers custom plans based on data volume and integrations.
How to Choose the Right Customer Experience Platform
Picking the perfect CX software isn’t about ticking boxes—it’s about finding a partner that grows with your goals. Here’s how to cut through the noise:
Start by defining your goals. What’s really driving your software purchase? Maybe you’re drowning in customer calls and need smarter self-service tools. Or perhaps your customer feedback surveys are gathering dust, and you crave AI that turns rants into action plans.
Nail down your non-negotiables first and figure out exactly what it is you’re looking for.
Remember that size matters (in data, at least). If you’re a high-volume brand with sprawling customer behavior data, you’ll want enterprise-grade muscle, like AI that spots trends in real-time and data encryption that keeps compliance airtight.
Smaller teams should focus on simplicity. Don’t just opt for the biggest, flashiest piece of software you can find. Consider exactly what you need and whether or not you’re choosing software that’s more extensive than you really need.
Play nice with others. Great CX tools don’t live in a silo. If you’re already using a CRM or help desk, prioritize platforms that slide into your tech stack like the last puzzle piece. Bonus points if you can find software with pre-built integrations that save your IT team from migraines.
Demand more than pretty dashboards. Basic reporting is so 2020. Nowadays, you’ll want to look for tools that map entire customer journeys instead of just taking snapshots. Look for platforms that use AI to serve up the “why” behind the “what.”
Try before you buy. If it’s offered, never skip a demo. Involve your customer service teams in testing—if they groan at the interface, run. The best tools feel intuitive, not like you need a PhD to use them.
Find Your Ideal Customer Experience Management Platform With Interaction Metrics
Choosing the right CX software isn’t only about choosing software with the most advanced features on the market. It’s really about finding a solution that fits your team, your goals, and your customers’ quirks. With so many options (and hidden complexities!), it’s easy to feel overwhelmed.
That’s where we come in.
At Interaction Metrics, we’ve helped hundreds of businesses cut through the noise and land on platforms that actually work instead of buying the software that looks good on paper, only to find out it’s not actually what they need.
Whether you’re streamlining customer feedback surveys, taming chaotic customer calls, or scaling AI-driven insights, we’ll match you with tools that turn headaches into high-fives.
Contact us to discuss your customer experience goals. We’ll provide personalized recommendations, compare top contenders, and craft a roadmap that turns your customer experience into a competitive edge.
Customer Experience Management Software FAQs
Is a CRM the same thing as CX software?
Not exactly. They overlap, but they’re not identical.
A CRM (customer relationship management) focuses on organizing customer data, guiding sales teams, and tracking customer interactions from a lead perspective.
CX software digs into customer feedback, sentiment, and behavior across every channel—helping you collect feedback, pinpoint customer pain points, and deliver personalized experiences.
How much does the best customer experience management software cost?
Costs vary widely based on feature depth, data volume, and whether you need advanced AI or basic reporting.
Many enterprise solutions start around $75-$100 per user monthly, but custom quotes can climb higher. Especially if you handle large data sets, require enterprise-grade security, or want extra automation.
What is the best customer experience software for small businesses?
Most top-tier CX platforms are built for mid-sized to large enterprises with robust budgets and support team resources.
That said, smaller businesses might consider simpler customer service software or basic feedback management solutions with fewer bells and whistles (and lower costs).
These typically aren’t comprehensive solutions, but they include tools like SurveyMonkey, Zendesk, and Freshdesk among others.
Look for tools that let you start small and scale as your customer lifecycle grows. Need help choosing the right one? Contact Interaction Metrics to discuss your options. We already have licenses for the top CX platforms, so you can focus on insights—not software costs or setup—as you optimize the customer experience.
=================================
Let’s discuss which CX platform is best for your company.
=================================
The post The Best CX Software Of 2025 appeared first on Interaction Metrics.
]]>