Read more
The post Meet our Interaction Metrics GPT! appeared first on Interaction Metrics.
]]>Introducing the latest team member to join Interaction Metrics: there’s now an Interaction Metrics GPT!
You can ask our OpenAI-backed search bot anything you want about customer surveys, customer service, or anything else related to measuring and improving the customer experience. Check it out here!
Here are a few questions you might want to ask Interaction Metrics GPT:
- What are some best practices for getting customer feedback?
- What’s an NPS score?
- What is weighting in surveys?
- What is survey sampling?
- What are some common examples of survey bias?
- What are some alternative CX methods to surveys?
- What are some factors that contribute to the cost of a customer survey program?
- Why is the email subject line important for surveys?
- Should customer surveys be anonymous?
- What is customer experience?
- What’s the best way to measure the customer experience?
- What’s the advantage of hiring a third-party consultant to administer surveys?
- What are the most common survey mistakes?
- How can I increase my survey response rate?
- What software tools do you need to run a survey?
- How often should you do employee surveys?
- What are the best ways to improve and measure customer service?
At Interaction Metrics, we love using AI tools to make CX more efficient and effective.
Want to talk about the latest tools and trends in CX, get in touch!
The post Meet our Interaction Metrics GPT! appeared first on Interaction Metrics.
]]>Read more
The post Call Center Training: Jason Bader Interviews Martha Brooke appeared first on Interaction Metrics.
]]>In this episode of the podcast Distribution Talk, Jason Bader has a far-reaching conversation with Martha Brooke. Martha briefly touches on how Interaction Metrics measures and improves the customer experience; then, Jason narrows in on call center training. Martha explains that customer service is a subset of customer experience and discusses how to evaluate and elevate call center interactions based on four key dimensions: Efficiency, Information, Connection, and Differentiation; within each dimension, there are usually several elements.

Case Study Explored:
Martha and Jason dissect a distribution company that sought to improve its inside sales customer service. The client achieved a 50% improvement in performance over a six month period, highlighting the necessity for employing programs, not just one-and-done call center training projects. Listeners interested in discussing the customer experience can contact Martha here.
Call Center Training Episode Summarized:
- What do Interaction Metrics’ clients have in common? They are all serious about the customer experience, of which customer service and call center training are critical components. Martha says, “When the customer thinks about their experience, they wonder if you have the right inventory. Will the product arrive on time?” “If you didn’t have it in stock, were there alternates? What’s the quality of your website? What about the portal? There’s almost nothing about a company that’s not customer experience.”
- Martha and Jason discuss a program that started by surveying customers and employees to assess customer service perceptions. The metric came in at 54 on a scale of 0 to 100, indicating a clear need for improvement.
- This led to a program involving recorded call analysis and call center training workshops. The Interaction Metrics’ solution included setting the criteria for what constituted great customer service for this specific distributor and establishing a Playbook for how interactions (email and call) should unfold.
Highlights from the Conversation:
This interview has been edited for length and clarity.
Martha: “Often with customer service, there is no objectivity. When we say, “I know it when I see it” or make other subjective evaluations like, “I like him, or I don’t like him,” it’s not scientific, and it’s not useful. Most importantly, subjectivity doesn’t help customer service reps improve their game.
Customer service criteria are going to be different for every company. But for all companies, there are four dimensions to customer service. The first one is Efficiency—did you value the customer’s time? The second is Information—did you answer their questions? The third is Connection—Did you sound like you were listening? And the fourth dimension is what we call Differentiation or pop—were you exceptional in some way, or did you sound like any call center anywhere?”
Martha:“For most customer service interactions, Information has an outsize impact because the customer isn’t calling to jabber, no of course not, they are calling to get answers.
The customer wants to know things like: What inventory do you have? When will you get something in stock if you don’t have it in? Can you expedite it? What are some alternatives? When can you get those other options?” Martha continues by explaining how Information is evaluated and how it is specific to each client.
Jason: “Where would a greeting fall in? Do you get points for saying their name?”
Martha: “Usually, that’s a part of connection. And it happens right away when the customer is, from the outset, judging whether they will enjoy talking with the rep. Another example of connection would be what we call listening or affirming words. Generally, we’re looking for affirming or listening words to happen two or three times in a short conversation or four or five times in a long conversation. In our call center training, we focus on finding what’s natural. What are natural words for reps to use?” And our Playbooks emphasize word choices that make sense for specific contexts.
Martha: “Sometimes, you need to put the customer on hold, right?”
Jason: “Yeah. That’s not good from the customer’s perspective. So, there’s got to be a way to do it professionally.”
Martha: “The rep should clearly say something like, ‘I need to put you on hold to check our inventory, and it will take about XYZ minutes.’ All too often, without solid call center training, we hear reps talking or whistling to themselves while they look things up. And sometimes, you’ll hear the customer say, ‘Are you there?’ Customers appreciate being told why they’re being put on hold, and how long it will take.”
Martha: “Scoring always improves performance. It’s human nature. If you know you’re getting a score from an objective third-party, you’re incentivized to perform better, especially if there is a material incentive for your performance.”
Jason: “I know you did workshops, and you did some individual coaching. What was the reaction? What about the individuals who were caught with a poor score? How did they react to coaching and scrutiny?”
Martha: “In general, it was it was very, very positive. The reps appreciated getting that kind of attention. In general, from the reps, there was this sense that they matter because they were being invested in.”
Continuous Training for Improvement:
Jason: “What else do you think is important for call training programs?”
Martha: “We encourage clients to do programs. I recommend a quarterly program at minimum. That way, you have a Customer Experience Dashboard that makes everything abundantly clear. Our dashboards filter down to location, reps, particular calls and emails.
Call center training programs don’t have to be daily to be effective, but there needs to be a commitment to an objective, expert third-party view. There are many methods like surveys, interviews, call scoring, and email scoring that can be used to measure objectively. But the main point is that the only gains that matter are ones you can prove scientifically. Unless you have data scientists on staff you need a third-party to do this for you. “
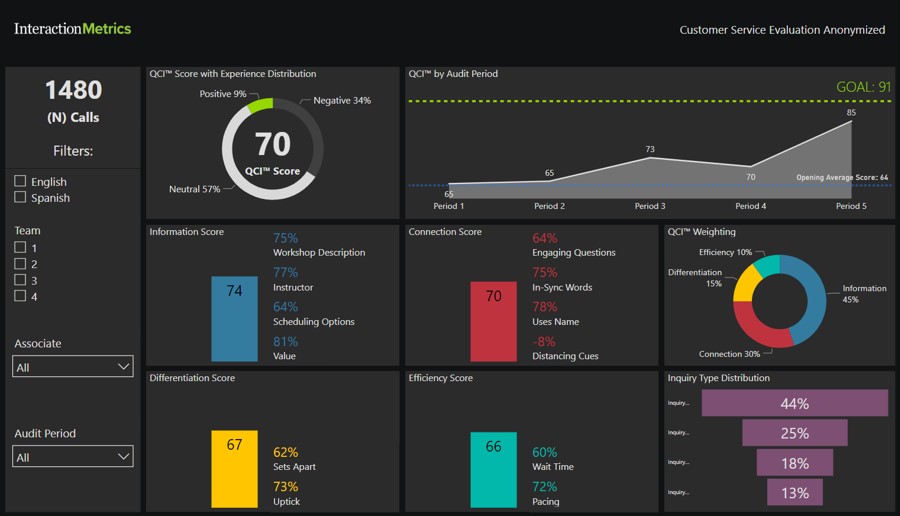
Click on the image for an interactive Customer Experience Dashboard example.
To read the entire transcript of the podcast, go here.
===============================================
Interested in customer service or call center training? Get in touch!
The post Call Center Training: Jason Bader Interviews Martha Brooke appeared first on Interaction Metrics.
]]>Read more
The post Net Promoter Score (NPS): Pros & Cons appeared first on Interaction Metrics.
]]>The Net Promoter Score (NPS) is the most well-known customer satisfaction metric used by two-thirds of the Fortune 1000 companies. But it’s also easy to misunderstand and misuse.
Created in 2003 by Fred Reichheld of Bain & Company, the Net Promoter Score (NPS) asks: “How likely are you to recommend us to a friend or colleague?�? Customers answer on a 0-10 scale. Then, the Net Promoter Score (NPS) is the percent of promoters (9-10) minus the percent of detractors (0-6). That means if everyone rated you a 9 or a 10, your NPS Score would be 100! However, the average NPS Score is a far cry from 100; in fact, according to Survey Monkey, it’s 32 and varies widely by industry.

Net Promoter Score (NPS) has the advantage of being straightforward to calculate and comprehend. Also, it’s potentially relevant for some companies because the question emphasizes the customer’s social orientation by framing their likelihood to recommend in the context of their friends.
But the Net Promotor Score (NPS) has its drawbacks too. Here are a few:
- Given the popularity of the Net Promoter Score (NPS), companies can appear insincere when they ask the NPS question. Customers are so used to answering the NPS question that they may assume a company is not genuinely interested in what they have to say.
- The NPS categorizes all scores between a 0 and a 6 into a single category of detractors, but that’s a wide range in customer sentiment that’s worth breaking down.
- The Net Promoter question may not be a great fit for every company or every situation. For example, specialty manufacturers can provide an excellent customer experience, and yet it’s unlikely customers would recommend these kinds of companies to their friends or even necessarily their colleagues.
- The Net Promoter question does not work for all customer experience touchpoints, like website navigation or product packaging. Nevertheless, these touchpoints are critical to the customer’s experience.
- Finally, the Net Promoter Score (NPS) does not include a weighting factor to reflect the relative importance of various aspects of the customer experience.
With these considerations in mind, it’s critical to ask whether the NPS question is the right fit for your company. Does the metric match your company’s objectives?
In certain industries, customers aren’t likely to recommend companies to their peers at all, no matter what their satisfaction level might be. That’s why we generally recommend the Net Promoter Score (NPS) is best for companies in industries where customers are likely to recommend them, such as luxury hotels or spendy restaurants.
Deploying Net Promoter Score (NPS)
Whether you conduct NPS Surveys monthly, quarterly, or annually, aim to gauge customer sentiment toward your company as a whole. Periodic assessments will help you monitor your customer health and establish a benchmark for your company’s success.
While some companies use NPS after transactions like product delivery or customer service interactions, the question isn’t suited to that. After all, customers don’t recommend you based on one event. Instead, your customers will recommend you (or not) because of their overall experience from start to finish and over time.
Segmenting NPS is Critical
Segmenting your NPS scores by demographics, customer categories, or product groupings is necessary to glean actionable customer insights. Without these segmentations, you will probably be at a loss for what actions to prioritize and which next steps to take. So, while you might report one aggregate score, practically speaking, you will work with several NPS scores.
Are you considering using Net Promoter Score (NPS)? If so, get in touch.
The post Net Promoter Score (NPS): Pros & Cons appeared first on Interaction Metrics.
]]>Read more
The post What Is Net Promoter Score (NPS) & Why Does It Matter? appeared first on Interaction Metrics.
]]>Last Updated: February 6, 2025
The Net Promoter Score (NPS) is the most well-known customer satisfaction metric used by two-thirds of the Fortune 1000 companies. But it’s also easy to misunderstand and misuse.
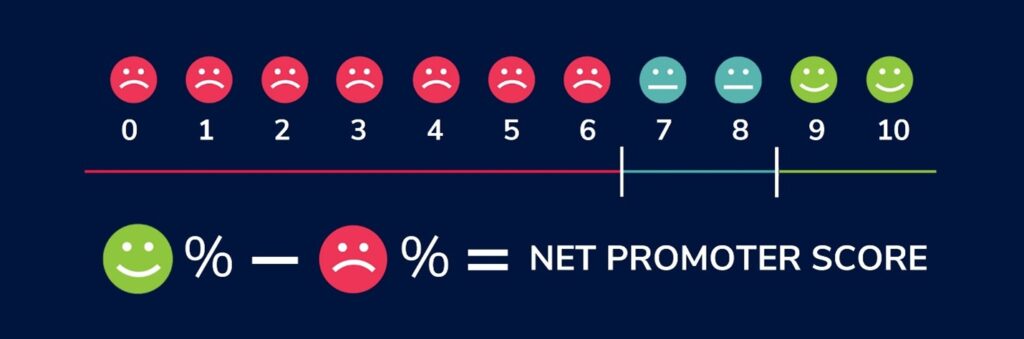
Created in 2003 by Fred Reichheld of Bain & Company, the Net Promoter System finds out: “How likely are you to recommend us to a friend or colleague?” Customers answer on a 0-10 scale. Then, the Net Promoter Score is the percent of promoters (9-10) minus the percent of detractors (0-6). That means if everyone rated you a 9 or a 10, your NPS would be 100! However, the average NPS Score is a far cry from 100; in fact, according to Survey Monkey, it’s 32 and varies widely by industry.
Imagine you run a local coffee shop. You’d want to know if your customers love your coffee enough to keep coming back and even tell their friends about it, right? That’s where the Net Promoter Score comes in. It’s like a popularity contest for businesses, but instead of votes, you get scores on how likely customers are to recommend your business to others.
The beauty of NPS is its simplicity. You ask one key question: “On a scale of 0 to 10, how likely are you to recommend us?”
Based on their answer, customers fall into three camps:
- Promoters (9-10): These are your superfans, the ones who not only come back but also bring their friends.
- Passives (7-8): They’re okay with your service but aren’t singing your praises from the rooftops.
- Detractors (0-6): These folks are unhappy customers. They might tell others to steer clear, signaling there’s work to be done.
Partnering with NPS Survey experts at Interaction Metrics ensures your NPS surveys are well-designed and scientifically analyzed to deliver the insights needed to drive meaningful improvements.
Here’s everything you need to know about NPS and why it matters.
Why Is NPS Important?
A high NPS means you’re doing something right; your customers are your advocates. A low score? It’s a red flag that people might be looking for the exit, or at least, they’re not sticking around to sing your praises.
Businesses use this score like a compass. It helps them gauge overall customer happiness, spot trends in brand perception, and pinpoint where they need to improve. By diving deeper into why people are promoters or detractors, companies learn what makes customers loyal or what’s pushing them away. Plus, by linking NPS with data like sales, how long customers stay, and how often they leave, businesses can see how happy customers translate into dollar signs.
Industries such as retail, hospitality, financial services, and technology frequently rely on NPS to gauge customer sentiment. For companies in competitive markets, tracking NPS trends can provide a significant advantage, allowing them to adjust their customer experience efforts in real time to maintain or improve loyalty.
How to Calculate Net Promoter Score (Step by Step)
Calculating your Net Promoter Score is like baking a simple cake – follow the recipe, and you’ll have your answer. Here’s the straightforward method
Step 1. Ask the Magic Question: You only need to pose one question to your customers: “On a scale from 0 to 10, how likely are you to recommend our product or service to a friend or colleague?”
Step 2. Sort the Answers: Based on their responses, customers fit into one of three groups. Promoters (individuals who score 9-10) are your brand evangelists. Passives (people who score 7-8) are neither here nor there. Detractors (people who score 0-6) are the ones who might be warning others not to work with your company.
Step 3. Do the Math: Here’s where it gets a bit like mixing ingredients. Subtract the percentage of Detractors from the percentage of Promoters. That’s your NPS.
If 50% are Promoters and 10% are Detractors, your NPS is 50 – 10 = 40.
The final Net Promoter Score calculation can be performed using this formula:
NPS = (% of Promoters) – (% of Detractors)
As another example, if 60% of respondents are Promoters, 25% are Passives, and 15% are Detractors, the calculation would be:
60% – 15% = 45 (NPS)
What Is a Good NPS Score?
A good Net Promoter Score depends on your industry and customer expectations. NPS scores range from -100 to 100, with higher scores indicating stronger customer loyalty. However, what qualifies as a “good” score varies by sector and business model.
Industry Benchmarks
Different industries naturally produce different NPS benchmarks.
Luxury brands and hospitality often have high NPS, sometimes reaching 70 or higher, as personalized service and premium experiences drive customer loyalty.
Retail and e-commerce companies tend to have mid-range scores, typically between 30-50, depending on product quality and customer service.
Telecommunications and financial services often see lower scores, sometimes between 0-30, due to higher customer expectations and frequent service-related complaints.
Companies should benchmark their NPS against competitors within their industry rather than comparing themselves to unrelated businesses.
What Qualifies as a Strong, Average, or Weak NPS Score?
Excellent scores range from 70-100. This indicates very high customer loyalty and strong word-of-mouth recommendations.
Good scores range from 50-69. A score that falls in this range is solid, and indicates enthusiastic customers who are likely to promote the brand.
Average scores range from 30-49. These indicate mixed customer sentiment; some customers are promoters, but there are also a notable number of passives and detractors.
Poor scores range from 0-29. Scores that fall in this range signal customer dissatisfaction and potential churn risk. Companies in this range should focus on improving customer experience and addressing concerns raised by detractors.
Negative scores range from -100 to -1. Negative scores are major red flags indicating widespread customer dissatisfaction that requires urgent action.
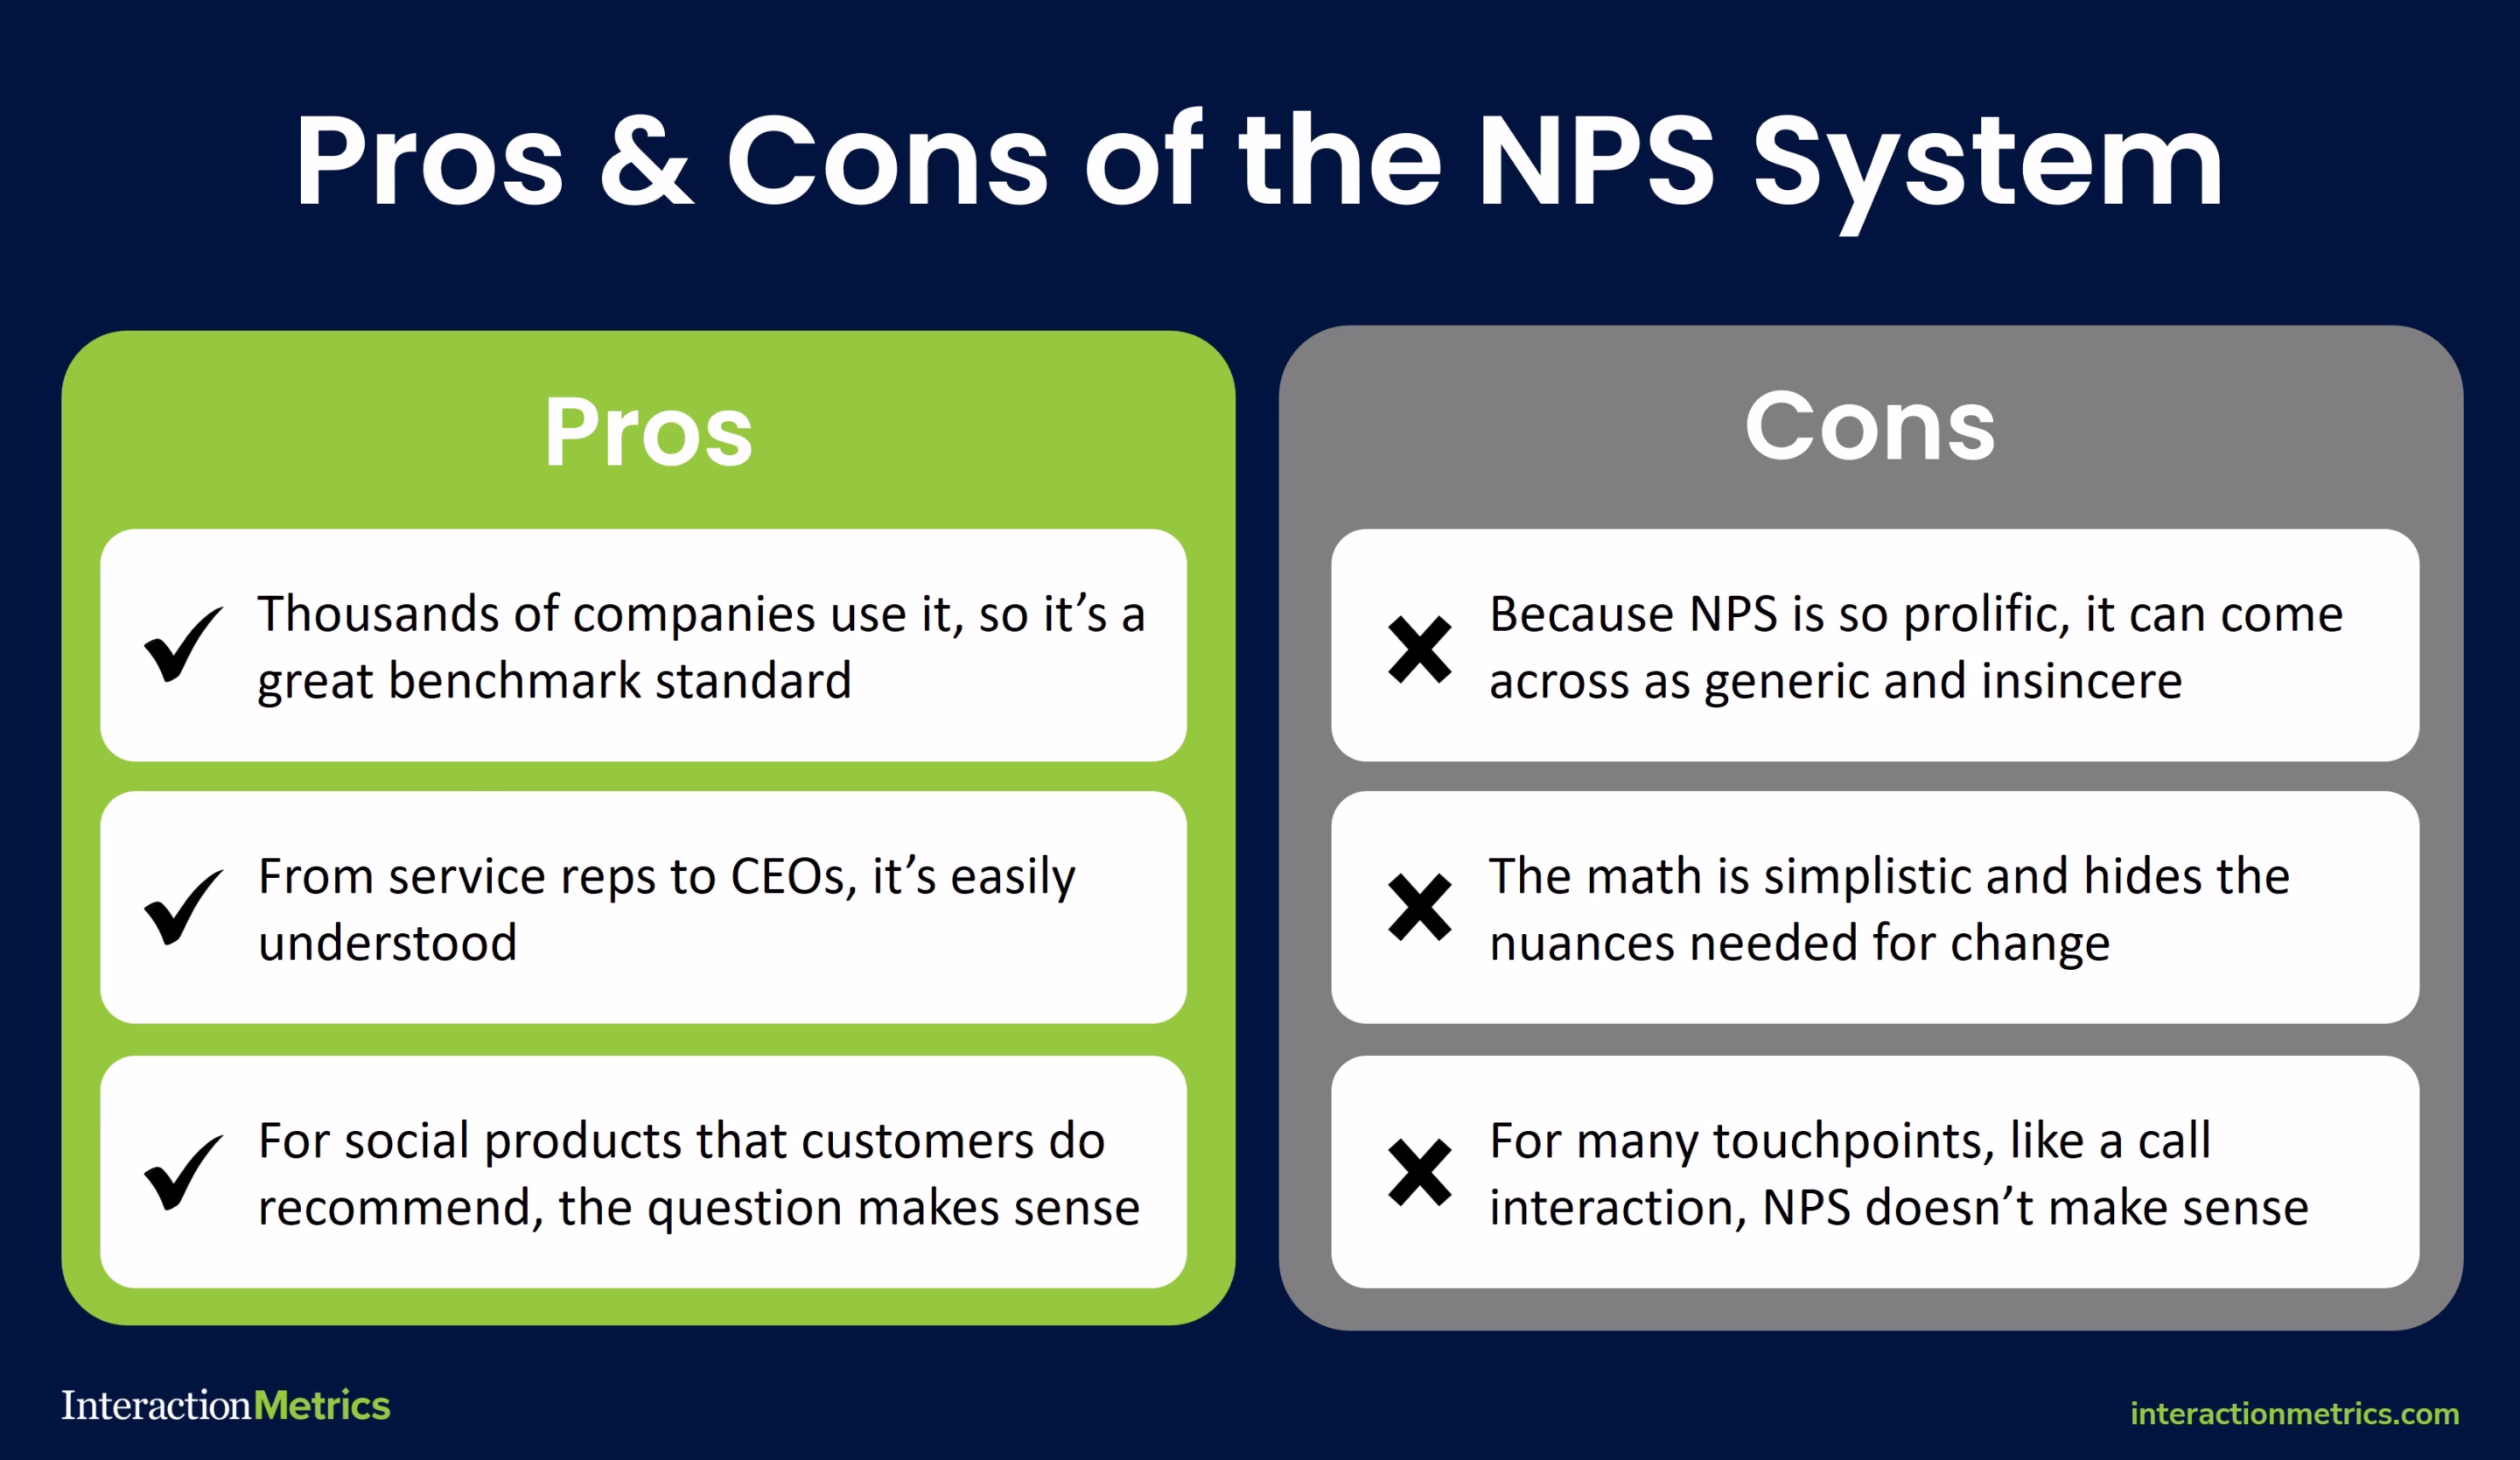
The Pros & Cons of the NPS System
The Net Promoter Score is easy to figure out and understand. It’s useful for businesses because it asks customers how likely they are to suggest the product or service to their friends, focusing on their social behavior.
But the Net Promotor Score has its drawbacks too. Here are a few:
- Given the popularity of the Net Promoter Score (NPS), companies can appear insincere when they ask the NPS question. Customers are so used to answering the NPS question that they may assume a company is not genuinely interested in what they have to say.
- The NPS categorizes all scores between a 0 and a 6 into a single category of detractors, but that’s a wide range in customer sentiment that’s worth breaking down.
- The Net Promoter question may not be a great fit for every company or every situation. For example, specialty manufacturers can provide an excellent customer experience, and yet it’s unlikely customers would recommend these kinds of companies to their friends or even necessarily their colleagues.
- The Net Promoter question does not work for all customer experience touchpoints, like website navigation or product packaging. Nevertheless, these touchpoints are critical to the customer’s experience.
- Finally, the Net Promoter Score does not include a weighting factor to reflect the relative importance of various aspects of the customer experience.
With these considerations in mind, it’s important to ask whether the NPS question is the right fit for your company. Does the metric match your company’s objectives?
In certain industries, customers aren’t likely to recommend companies to their peers at all, no matter what their satisfaction level might be. That’s why the Net Promoter Score is generally best for companies in industries where customers are likely to recommend them, such as luxury hotels or restaurants.
More broadly, it’s never enough to simply send an NPS survey. Instead, you need to optimize the Net Promoter question with a follow-up strategy to ensure customers feel heard and you have the insights you need to move your company forward.
How to Collect NPS Feedback
Whether you conduct NPS Surveys monthly, quarterly, or annually, aim to gauge customer sentiment toward your company as a whole. Periodic assessments will help you monitor your customer health and establish net promoter score benchmarks for your company’s success.
While some companies use NPS after transactions like product delivery or customer service interactions, the question isn’t suited to that.
After all, customers don’t recommend you based on one event. Instead, your customers will recommend you (or not) because of their overall experience from start to finish and over time.

Survey Collection Methods
Choosing the right method for collecting NPS feedback is the key to obtaining accurate and actionable insights. Businesses can gather responses through various channels, each with its advantages and considerations.
Email Surveys
Email surveys are one of the most common and effective ways to collect NPS data. They allow businesses to reach a broad audience while providing customers with the flexibility to respond at their convenience.
Best practices for email surveys:
- Keep the subject line short and clear to encourage higher open rates.
- Personalize the email with the recipient’s name or relevant details.
- Send the survey within an appropriate time frame—such as shortly after a key customer interaction—to capture relevant feedback.
- Follow up with non-responders to increase response rates.
Website Pop-Up Surveys
Website pop-up surveys collect feedback from customers while they are actively engaging with a business’s website or platform. These surveys are especially useful for capturing sentiment about user experience, navigation, or an ongoing transaction.
Best practices for website pop-up surveys:
- Trigger surveys at the right time (e.g., after checkout, upon exit intent, or after a specific interaction).
- Keep the survey brief—customers are more likely to engage with one or two quick questions.
- Ensure the pop-up is not intrusive or disruptive to the user experience.
SMS Surveys
SMS surveys enable businesses to collect feedback quickly and efficiently via text messages. These surveys tend to have higher open rates compared to email and are particularly effective for gathering feedback after a service interaction or purchase.
Pros and cons of SMS surveys:
 High open and response rates compared to email surveys.
Easy to deploy and reach mobile users.
 Limited space for detailed questions.
Can be perceived as intrusive if not timed appropriately.
Phone Interviews
Phone interviews provide an opportunity for businesses to collect detailed feedback directly from customers. These surveys are best suited for high-value customers or situations where additional context is needed.
When to use phone interviews:
- When you need deeper qualitative insights beyond the NPS.
- When working with B2B clients or high-value customers who require personalized engagement.
- When addressing concerns from detractors to improve retention and loyalty.
By selecting the right survey method for their audience, businesses can ensure they gather reliable and meaningful NPS data that leads to actionable improvements.
Best Practices for Collecting Accurate NPS Data
Collecting Net Promoter Score data takes thoughtful planning to make sure results are accurate, meaningful, and actionable.
Following these best practices can help you maximize the value of your NPS surveys.
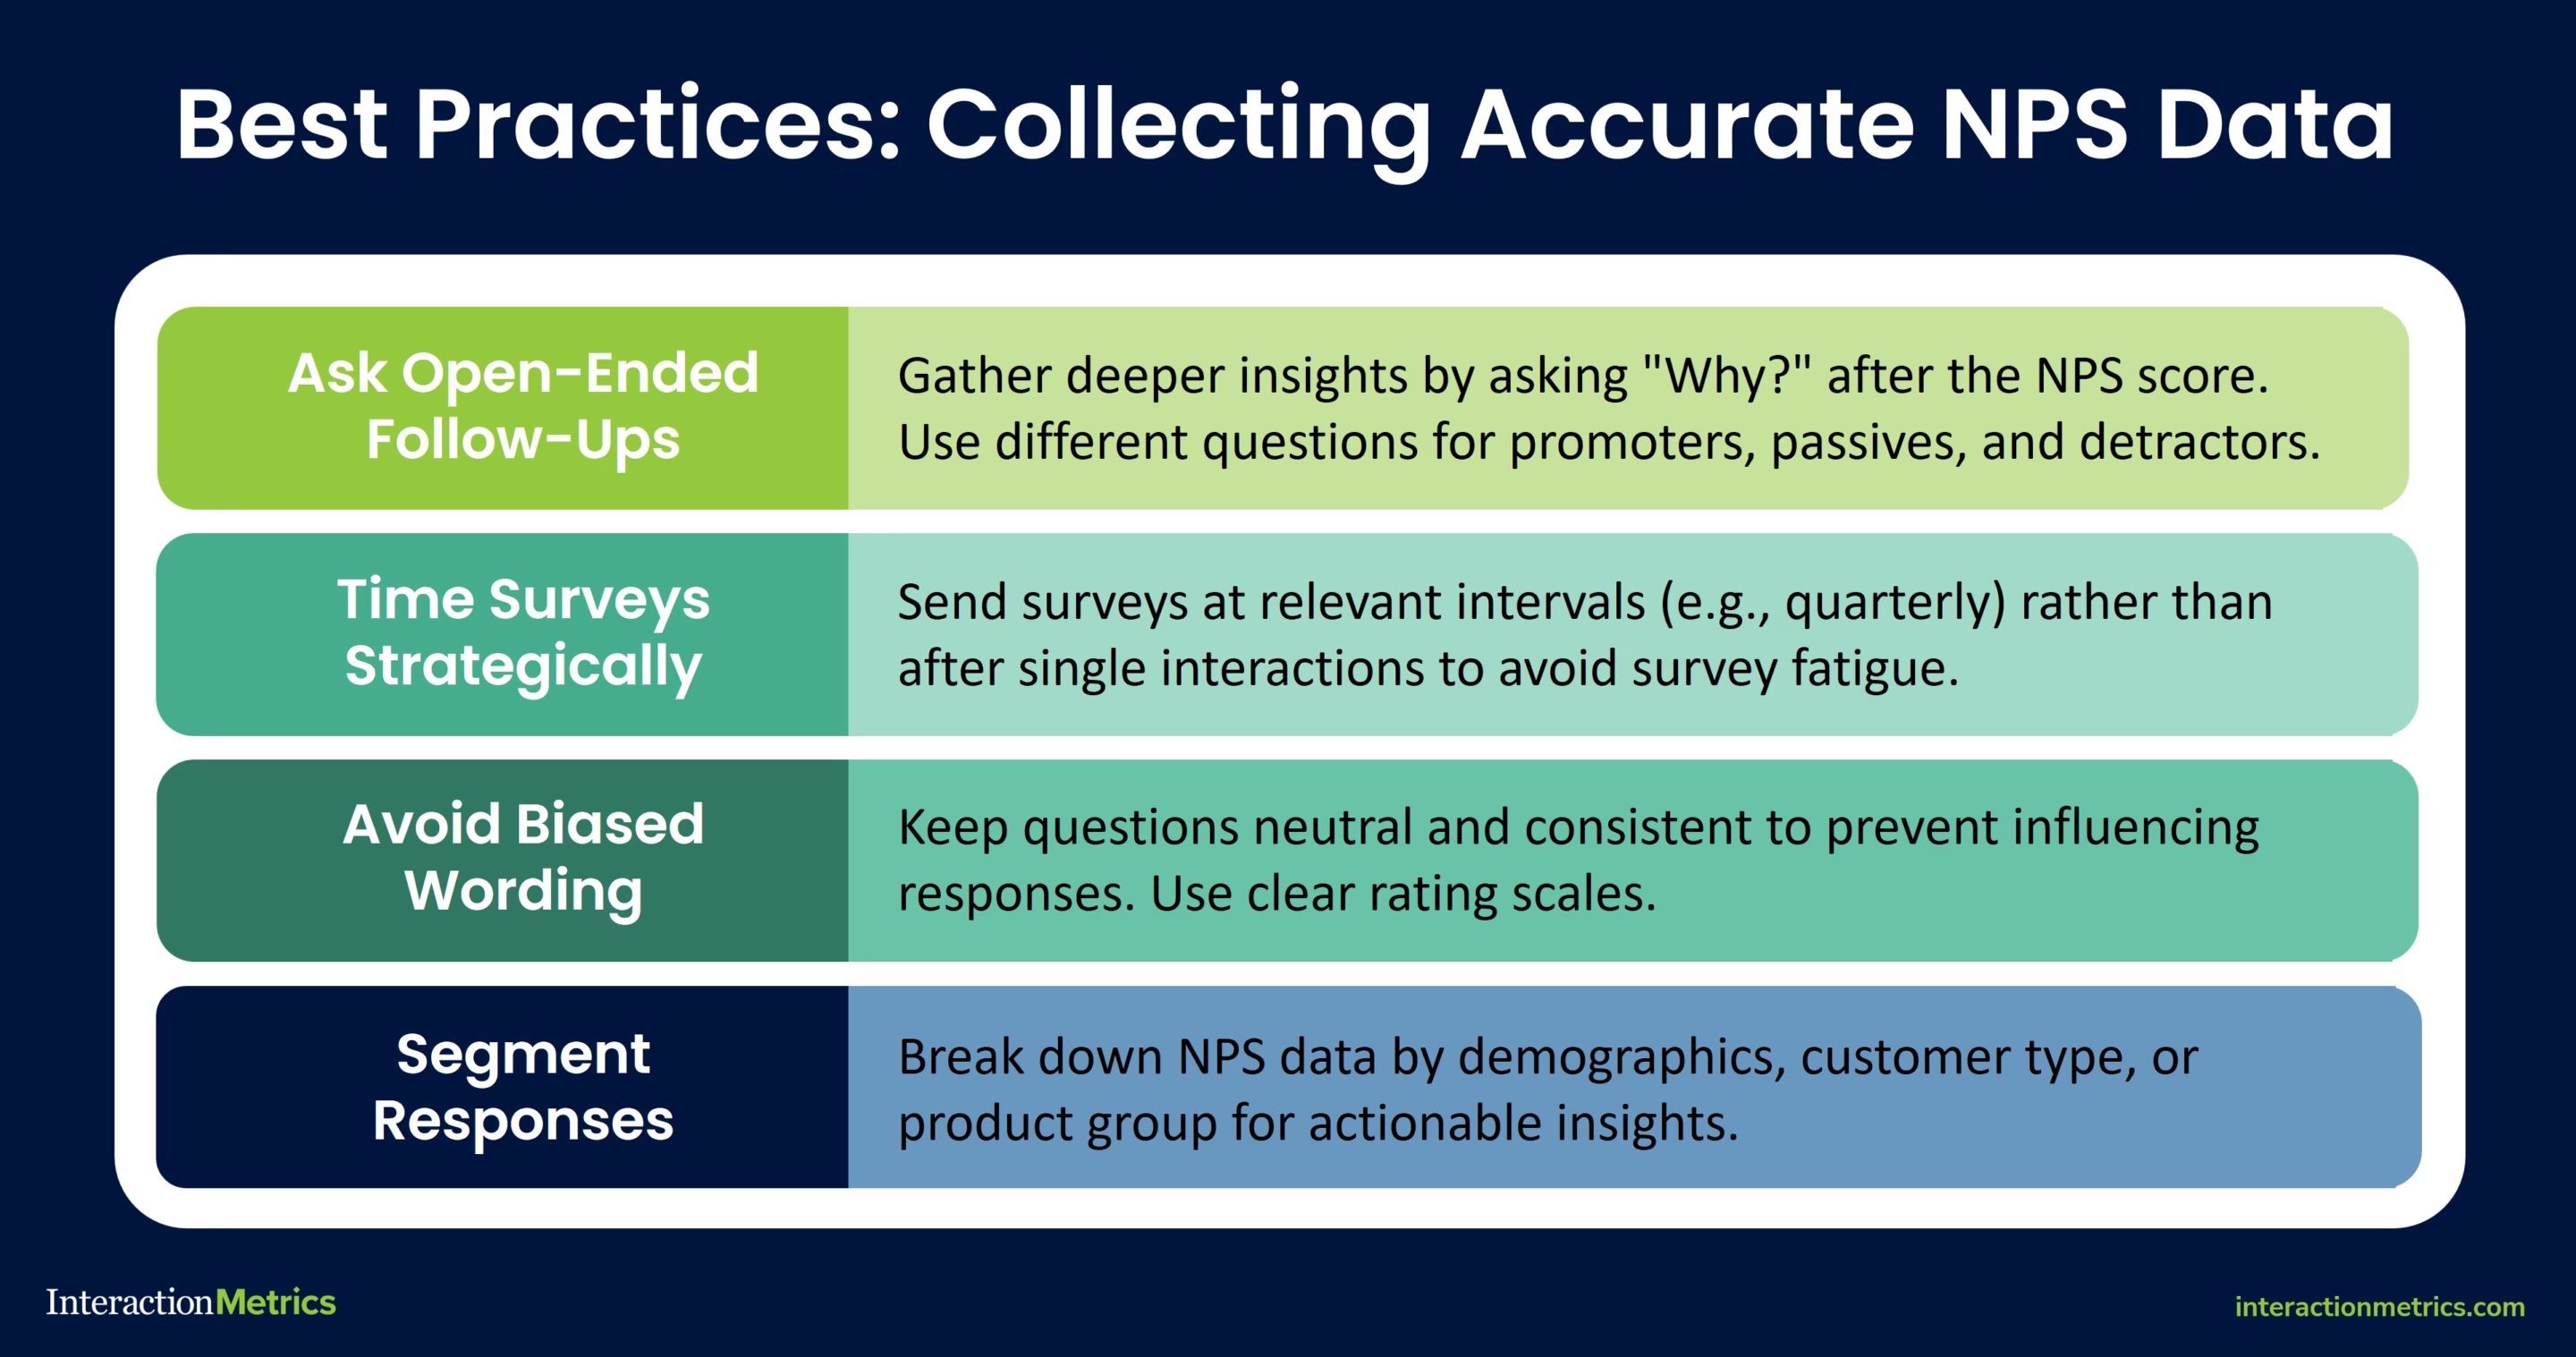
Ask Open-Ended Follow-Up Questions
While the NPS question provides a numerical score, it does not explain why customers feel the way they do.
Including an open-ended follow-up question—such as “How could CompanyABC improve?”—helps businesses uncover key drivers behind customer sentiment.
You can also use survey logic to ask different follow-up questions to promoters and detractors.
For example, you might ask promoters “What would make your experience with CompanyABC even better?”
For passives and detractors, you may want to ask something like “What challenges have you had while working with CompanyABC?”
This qualitative feedback provides deeper insights that a numerical score alone cannot offer, which lets companies take targeted action to improve the customer experience.
Time Surveys for Maximum Response Rates
Survey timing plays a critical role in gathering useful responses.
When a company asks a customer to take a survey, they are asking for the customer’s time, insights, and effort. That time should be honored with a form of reciprocity.
This could mean offering a tangible incentive, such as a discount or reward, but more importantly, it means showing customers that their feedback leads to meaningful outcomes.
Without this mutual exchange, surveys become extractive—a one-sided demand rather than an invitation to co-create a better experience.
Businesses should always respect their customers’ time, and send NPS surveys.
That means you shouldn’t send an NPS survey shortly after key interactions (e.g., after a purchase, service experience, or customer support call) to capture fresh, relevant feedback.
Think about it, and it makes sense: most people wouldn’t recommend a company to a friend based on their experience during a single phone call.
Instead, most people would recommend a company after working with them for an extended period of time. This is why sending NPS surveys at strategic intervals (e.g., quarterly or bi-annually) to track trends over time is a better strategy.
It’s also important to avoid survey fatigue, meaning you should avoid sending “survey spam.” Sending surveys too frequently to the same customers can leave them frustrated, cause lower response rates, and skew data.
Avoid Leading Questions That Create Biased Responses
The way questions are worded can unintentionally influence how customers respond. For objective results:
- Keep the wording neutral—avoid overly positive or negative phrasing that may push respondents toward a certain answer.
- Make sure the survey uses a consistent structure for all customers. This minimizes variations in responses that may happen due to the order of questions or their context.
- Provide clear, easy-to-understand rating scales so that customers know exactly how their responses are being interpreted.
Segment NPS Data for Deeper Insights
Segmenting your NPS by demographics, customer categories, or product groupings is necessary to glean actionable customer insights.
Without these segmentations, you will probably be at a loss for what actions to prioritize and which next steps to take.
So, while you might report one aggregate score, practically speaking, you will work with several scores.
Analyzing results by customer type, demographics, or product usage can unveil hidden trends in customer sentiment.
For example, different product lines may generate significantly different scores. This could indicate that some offerings are better received than others.
Similarly, customer segments based on location, age, or business size might display clear loyalty patterns that can help refine marketing and customer service strategies.

Track NPS Over Time
Tracking NPS trends over time is just as important as segmenting by customer type. A single score provides a snapshot, but monitoring changes over months or years can highlight whether initiatives to improve customer satisfaction are working.
If scores are declining, it signals the need for immediate intervention.
We recommend using a dashboard like the interactive example below to monitor NPS over time. It lets you filter by NPS Grouping, Team, Market Vertical, and Customer Type, so you can make meaningful comparisons across different customer segments and make informed decisions.
If specific segments of customers consistently provide lower scores, companies can focus on improving those interactions to enhance overall satisfaction.
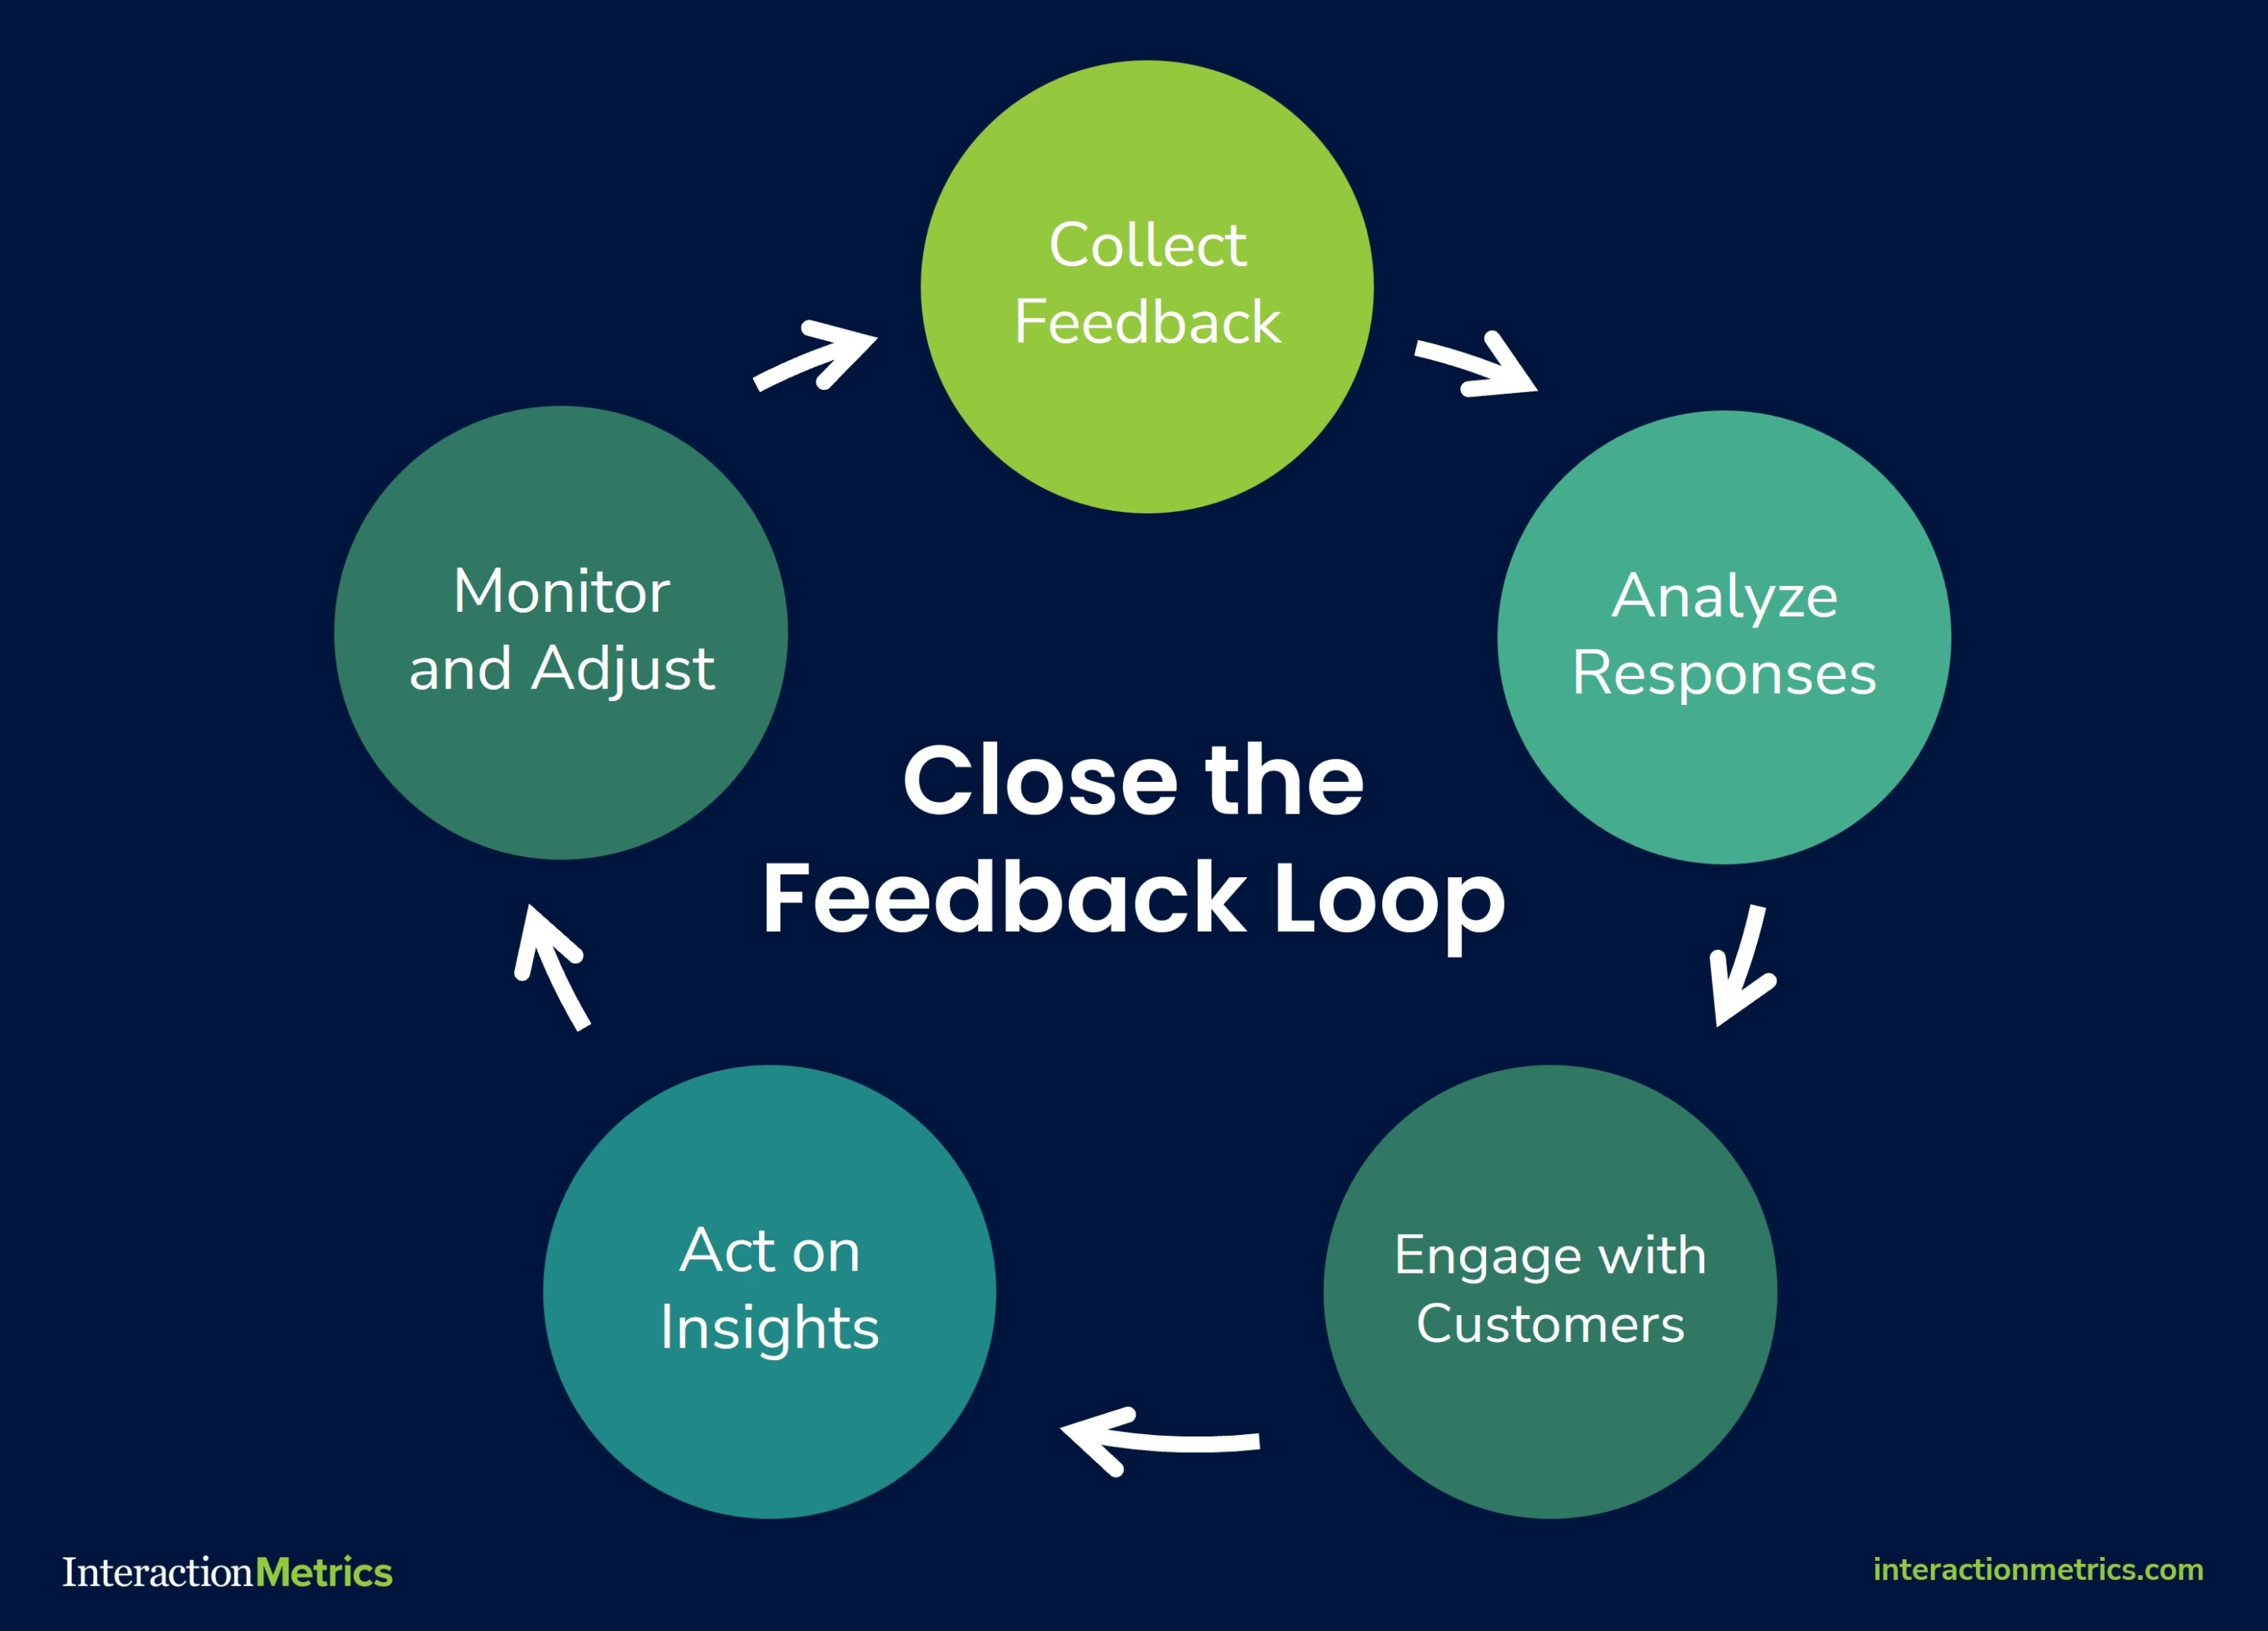
Close the Feedback Loop
Closing the feedback loop means making sure that customer concerns are actually addressed, improvements are made, and relationships are strengthened.
The reason this is so important is that most customer surveys today are a farce.
They are sent from “do not reply” email addresses, which means customer data they collect vanishes into a black hole.
Companies ask for feedback, but when they don’t close the feedback loop, they fail to acknowledge or act on it.
Simply gathering NPS data without following up can leave valuable insights untapped and customers feeling unheard.
Remember, surveys are conversations, not transactions. If you’re asking for feedback, be prepared to listen and respond.
One of the most effective ways to close the loop is by reaching out to detractors—customers who rated their experience between 0 and 6.
These customers are at risk of churning, but engaging them directly can turn a negative experience into an opportunity for retention.
Businesses should follow up with detractors promptly, acknowledge their concerns, and take actionable steps to resolve issues. This helps improve NPS over time while also building stronger relationships with your customers.
Businesses should also engage with promoters who rated their experience a 9 or 10 should also be engaged. Encouraging these people to leave reviews, share testimonials, or refer others can amplify positive word-of-mouth marketing.
In addition to individual follow-ups, businesses should analyze trends across all customer feedback and implement broader improvements. If detractors repeatedly mention a specific complaint, it signals a systemic issue that needs to be addressed.
Consistently closing the feedback loop fosters stronger customer relationships and demonstrates a commitment to continuous improvement.
How to Improve a Low Net Promoter Score
A low Net Promoter Score signals customer dissatisfaction and a risk of churn, but it also provides an opportunity for businesses to identify weaknesses and take targeted action to improve the customer experience.
The key to improving your net promoter score lies in a combination of qualitative feedback analysis, customer experience enhancements, and strategic resolution.
Identify Customer Pain Points Through Qualitative Feedback
NPS alone doesn’t tell the full story. To understand why customers feel the way they do, businesses need to analyze open-ended survey responses, customer complaints, and support interactions.
Identifying common themes among detractors (0-6) will reveal pain points such as product frustrations, slow service, or poor communication.
Without qualitative feedback, businesses risk making changes that don’t align with what truly matters to customers.
Use NPS Feedback to Enhance Customer Experience
Once businesses identify areas of concern, the next step is to implement customer experience improvements.
This may include streamlining support processes, improving product usability, or addressing specific complaints raised by detractors.
Companies should also focus on passives (7-8)—these customers are on the fence and could become promoters with minor enhancements to their experience.
Proactively engaging with passives and resolving their concerns can help lift overall NPS over time.
Strategies for Addressing Common Customer Dissatisfaction Issues
Companies with low NPS face common challenges like inconsistent service, unmet expectations, lack of communication, and insufficient proactivity. Addressing these issues requires:
- Improving response times: Slow customer service is a common complaint among detractors. Faster response times and proactive support can boost customer satisfaction.
- Setting clear expectations: Customers may rate a company poorly if there’s a disconnect between what was promised and what was delivered. Aligning marketing messaging with actual product capabilities helps prevent dissatisfaction.
- Training employees on customer engagement: Frontline employees play a massive role in customer satisfaction. Making sure they have the knowledge and tools they need to resolve issues efficiently can make an immediate difference in NPS.
That said, you may need to do more than implement the tips above to raise NPS. To figure out what else must be done, approach your customers from a perspective of curiosity. Use follow-up questions to determine what needs to change.
Run Your Next Net Promoter Survey With Interaction Metrics
A well-designed NPS survey should go beyond a single question and provide actionable insights that drive meaningful improvements. Interaction Metrics takes NPS to the next level by ensuring surveys are scientifically designed, free of bias, and tailored to uncover the real reasons behind customer sentiment.
While the rest of the industry encourages an indiscriminate flood of surveys, we hold the belief that surveys should be rare, intentional, and executed with precision.
Unlike traditional NPS surveys that rely on a one-size-fits-all approach, Interaction Metrics provides custom-built surveys designed to fit your unique business needs.
We analyze open-ended responses, integrate multiple data sources, and apply science-based methodologies to make sure your results are both accurate and actionable.
With transparent pricing, expert survey design, and deep analytical insights, Interaction Metrics helps companies move beyond a simple score and uncover the insights they need to create loyal customers, improve experiences, and drive business growth.
If you’re ready to gain real, data-driven customer feedback, contact Interaction Metrics today to get started on your next NPS survey.
Frequently Asked Questions About NPS
What should I ask when running an NPS survey?
When running an NPS survey, start with the standard NPS question: “How likely are you to recommend us to a friend or colleague?” on a 0-10 scale.
To gain deeper insights, follow up with open-ended questions such as “What is the primary reason for your score?” or “What could we do to improve your experience?”
These questions help businesses understand the why behind the score and uncover areas for improvement. Keeping the survey simple and focused will lead to higher response rates and more actionable feedback.
When should I run an NPS survey?
The best time to run an NPS survey depends on your goals and the type of feedback you want to collect.
Many businesses conduct NPS surveys periodically (quarterly or annually) to track customer sentiment over time.
Others run them after key interactions, such as a purchase, onboarding process, or customer service experience, to measure satisfaction at critical touchpoints – but this is a mistake! After all, customers don’t recommend you based on one event. Instead, your customers will recommend you (or not) because of their overall experience from start to finish and over time.
It’s important to avoid survey fatigue—sending surveys too frequently can lead to lower response rates and unreliable data. By choosing the right timing, businesses can capture meaningful insights that reflect customer loyalty and areas for improvement.
What is employee NPS (eNPS) and how is it different?
Employee Net Promoter Score (eNPS) measures employee loyalty and engagement. Traditional NPS evaluates customer satisfaction.
Instead of asking customers how likely they are to recommend a company, eNPS surveys might ask your customer service agents or other employees: “How likely are you to recommend this company as a place to work?”
Employees respond on the same 0-10 scale, with promoters (9-10), passives (7-8), and detractors (0-6).
While NPS helps businesses understand how customers perceive their brand, eNPS provides insights into workplace culture, employee satisfaction, and areas for organizational improvement.
A strong eNPS often correlates with better customer service, as engaged employees are more likely to deliver positive customer experiences.
How can businesses benchmark their NPS against competitors?
Businesses can benchmark their Net Promoter Score against competitors by comparing their scores to industry averages and sector-specific benchmarks.
Many research firms publish annual NPS reports that provide insights into typical scores across various industries, helping businesses gauge their performance relative to peers.
Companies can also collect competitive intelligence by analyzing public reviews, social media sentiment, and third-party survey data to understand how their customer experience compares.
Is segmenting NPS important?
Segmenting scores by demographics, customer categories, or product groupings is necessary to glean actionable customer insights.
Without these segmentations, you will probably be at a loss for what actions to prioritize and which next steps to take.
What metrics should you track alongside NPS?
To get a complete picture of sentiment throughout the entire customer journey, businesses should track additional metrics alongside NPS, including:
- Customer Satisfaction Score (CSAT): Measures immediate satisfaction with specific interactions, such as a support call or product purchase.
- Customer Effort Score (CES): Evaluates how easy it is for customers to complete key tasks, such as resolving issues or navigating a website.
- Churn Rate: Tracks the percentage of customers who stop using a product or service over a given period, helping businesses identify retention challenges.
- Customer Lifetime Value (CLV): Determines the total revenue a business can expect from a customer throughout their relationship.
============================================
Care to discuss your next Net Promoter Survey? Get in touch!
============================================
The post What Is Net Promoter Score (NPS) & Why Does It Matter? appeared first on Interaction Metrics.
]]>Read more
The post DEI Skepticism Can Be an Opportunity, Says Orange County Fire Authority appeared first on Interaction Metrics.
]]>Former IBM CEO Ginni Rometty said, “Diversity and inclusion are not policies and programs. They have been integral to our habits, practices and purpose for more than 100 years.”
True enough, DEI is so much more than a policy, it’s an approach, and a set of priorities. It’s the way an organization conducts itself. But it’s no secret that DEI programs can be controversial.
In fact, despite national awareness around issues of racial equity, employees often respond skeptically to DEI survey questions, making it difficult to succeed from the start.
Employees may be even more hesitant when their jobs require them to put their lives on the line to save others. When the stakes are this high, it’s understandable that some employees would view DEI programs as a distraction from the core mission.
This was the case at OCFA (Orange County Fire Authority), which serves 23 cities and nearly two million residents in Orange County, California. When OCFA first proposed a Diversity, Equity, and Inclusion initiative in 2021, some staff responded skeptically.
Common Reservations to DEI Initiatives
Fears of reverse discrimination, tokenism, retaliation, or lowered standards are common among employees when DEI programs are first introduced.
In fact, Harvard Business Review says many DEI programs fail, and tactics like diversity training, hiring tests, performance ratings, and grievance systems can exacerbate bias instead of reducing it.
Start with Facts
Coming from a scholarly background, Julián knew that without a data-driven approach to gathering employees’ thoughts and opinions, the chances of a DEI program successfully taking hold would be limited.
So before launching any DEI classes, consulting, or initiatives, Julián reached out to market research firm Interaction Metrics. He enlisted Interaction Metrics to write a DEI survey, implement it, and conduct its analysis. The objective? To foster a more inclusive, respectful, professional, and equitable workplace culture based on science.
To achieve that goal, I/M developed a fully double-blind anonymous survey to collect OCFA employees’ honest opinions and feedback.
DEI Survey Questions: Nuance and Detail
Off to the races! In March 2022, Interaction Metrics conducted OCFA’s first DEI survey. A whopping 42 percent of OCFA employees responded to the DEI survey questions. They answered both rating questions and, just as importantly, wrote copious answers to the open-ended text questions.
The findings? Interaction Metrics’ analysis showed many employees were skeptical of the need for DEI programs. For example:
- Some were concerned that hiring standards would be lowered to meet diversity quotas – this in an industry where first responders’ lives are at risk.
- Others felt that DEI programs played into a political agenda.
- And still others argued that any kind of DEI program would waste money and resources, believing that OCFA doesn’t have bias or inclusion problems.
For example, OCFA learned from their employees:
- How they rated the inclusivity of OCFA
- Whether they would recommend OCFA as a place to work
- How to introduce DEI to maximize its appeal
- And much, much more!
- First, having a third party issue the survey indicated how seriously OCFA takes DEI issues.
- Second, as mentioned above, the survey was strictly anonymous. Since respondents’ answers could not be traced back to them, employees were free to share their heartfelt opinions. Incentives to boost employees’ response rate were also offered anonymously.
- Third, working with an outside expert ensured that the DEI survey questions were phrased objectively.
- Last, meticulous text analysis tagging of employees’ verbatim responses ensured employees’ voices were heard.
Next Steps!
A year after issuing the survey and receiving Interaction Metrics’ analysis, Julián and the OCFA board have launched several DEI programs.
First, OCFA responded to employees’ skepticism by being transparent about its DEI process. For example, it now publishes a Quarterly Progress Report on the HR page of OCFA’s website showing “our staff the many aspects of our DEI program, well beyond simply identity and culture,” Julián said.
Second, the agency has shed light on one of its greatest assets: its generational diversity. Gen Z, Millennials, Gen X, and Boomers comprise OCFA’s staff, and each generation offers unique answers to DEI survey questions.
In addition, OCFA has launched three key DEI initiatives:
- Recruitment Team:
More than 60 OCFA staffers reach out to high school and college athletes, members of the military, and paramedics. They explain what a career with OCFA offers and the benefits of joining a fire service organization. The team’s goal is to reach individuals from demographics historically underrepresented in the fire service. - CARE Committee:
This new committee (still under process of formation) will advise OCFA’s management on how to foster a thriving workplace that reflects the diversity of Orange County. Also, this committee will ensure that OCFA’s language reflects equity and inclusiveness, and they will ensure there is adequate cultural competency training. Plus, they will review hiring data for diversity. - Courageous Conversations Training:
Since 1992, Courageous Conversations has facilitated healthy interracial dialogue in the workplace; their longevity gives them a depth of approach that goes beyond trends. That’s why in Q2 2023, OCFA Chiefs participated in a Courageous Conversations training, where everything was on the table, including sensitive topics like gender, sexual orientation, and politics in the workplace. Over time, more training will be added.
Embrace the Skepticism
Too many DEI programs launch without establishing objective DEI survey questions and a foundation based on understanding how employees feel. This results in misalignments between leadership and staff.
Starting with objective data means OCFA knows where employees stand and can track changes over time.
A few of the benefits of this data-backed approach are:
- With evidence in hand, it’s easier to achieve staff buy-in.
- Precise, nuanced next steps are clear.
- OCFA leadership can measure its DE&I programs’ impact with testing and data collection.
Employees’ skepticism of new programs is an opportunity for growth — when leaders address it directly.
To accelerate profitable and productive change, you need to address the heart of the matter and understand how all your employees think — not just the ones nodding in agreement.
Advice for Other Organizations
Most of the reluctance around DEI is from a misunderstanding of what it is, Julián said. A data-driven approach to analyzing employees’ sentiments has helped establish the program and clarify its goals.
Julián is part of a national committee developing a DEI toolkit for the fire service. He noted that his colleagues across the country face similar sentiments from staff. “If this were easy to do, there would be nothing to talk about,” he laughed.
- Want to hear more about OCFA’s DEI efforts? Contact Julián Velarde at Juliánvelarde@ocfa.org.
- Interested in collecting employee engagement and DEI data at your organization? Contact Martha Brooke at marthab@interactionmetrics.com.
And to discuss actionable DEI programs, get in touch!
This article was written in collaboration with OCFA and approved by its Human Resources & Communications Teams.
The post DEI Skepticism Can Be an Opportunity, Says Orange County Fire Authority appeared first on Interaction Metrics.
]]>